
 By
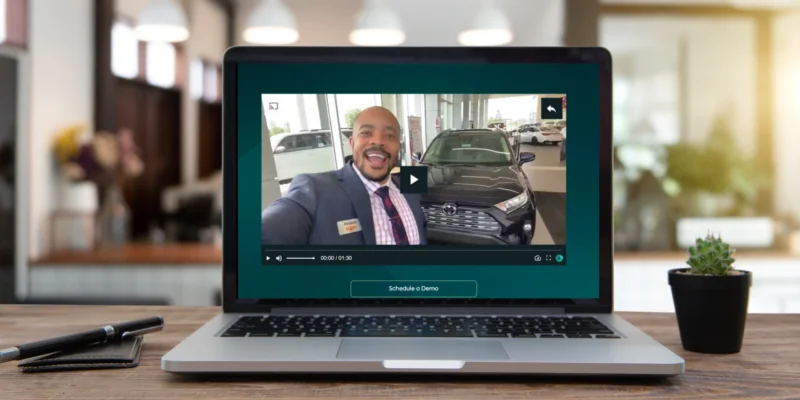
There is no single video sales letter length that consistently produces the highest sales conversion rate. Short videos can explain straightforward offers quickly. Longer videos can help customers understand unfamiliar products, evaluate evidence, and resolve important questions.
The right length depends on what viewers need to know before making a decision.
That is less convenient than a universal “seven-minute formula,” but it is more useful. A two-minute demonstration can sell a simple template effectively. A substantial training programme may require a longer explanation.
Here is what current video research shows, where the statistics need careful interpretation, and how to find a profitable VSL length for your own sales page.
What Is a Video Sales Letter?
A video sales letter presents an offer through a structured video.
It usually explains:
- Who the product serves.
- What problem it addresses.
- How the solution works.
- What evidence supports the claims.
- What the customer receives.
- What to do next.
A VSL can feature a presenter, screen recording, product demonstration, slides, or a combination. Its purpose is to help someone make a buying decision. It does not need to resemble a long presentation with dramatic music and repeated promises.
Sometimes showing the product clearly is more persuasive than spending several minutes describing how impressive it is.
What the Latest Video Statistics Actually Show
Much of the available research measures business video generally, rather than VSL purchases specifically. That distinction matters.
Short videos often retain a larger share of viewers
Vidyard’s 2025 benchmark report analysed 943,305 videos created during 2024.
It reported that:
| Video length | Viewers remaining engaged through the end |
|---|---|
| Under one minute | 65% |
| Over 20 minutes | 20% |
This supports the observation that shorter videos often achieve stronger completion. It does not establish that they generate more sales.
The report itself notes that “video length data only tells part of the story,” highlighting viewer intent and the stage of the sales process.
Longer videos can attract more commercial interaction
Wistia’s 2026 research combined a survey of more than 900 professionals with analysis of over 13 million videos and 79 million hours of viewing data.
Its findings showed that 30–60-minute videos generated the highest interactive click-through rates among the length groups discussed. These actions could involve a demo request, resource, or form rather than a purchase.
Wistia’s accompanying length guide reports an average 9% click-through rate for videos lasting 5–30 minutes. Again, that is not a 9% sales conversion benchmark for VSLs.
The evidence suggests useful patterns. It does not isolate video length as the cause.
Why Higher Completion Does Not Always Mean Higher Sales
Imagine two videos promoting the same course. The shorter version is easy to finish but leaves questions about the lessons and support. The longer version loses more viewers, yet answers those questions for people seriously considering enrolment.
The longer video could produce more purchases despite weaker completion. The reverse can also happen. Extra explanation may repeat information customers already understand and delay their decision.
Completion is therefore a diagnostic measure. Sales and contribution tell you whether the experience worked commercially.
Also distinguish:
- Average percentage watched: How much of the video people watch on average.
- Completion rate: The share reaching a defined endpoint.
- Average viewing time: The number of minutes watched.
- Purchase conversion: The share completing a purchase.
These numbers answer different questions.
Practical VSL Lengths to Test
The following ranges are editorial starting points, not statistically proven universal optima.
| Buying situation | Initial length to test | Main job |
|---|---|---|
| Familiar, straightforward product | 1–3 minutes | Show the benefit and purchase details |
| Product needing a demonstration | 3–7 minutes | Explain the workflow and result |
| Unfamiliar or more involved offer | 8–15 minutes | Establish understanding and answer concerns |
| Educational presentation for an interested audience | 15–30 minutes | Teach, demonstrate, and present the offer |
Use these ranges to plan an experiment, not to stretch a script.
A familiar audience may need little introduction. Someone arriving from an advertisement may need more context—or may have less willingness to watch.
Price matters, but it is not the only factor. Complexity, perceived risk, prior knowledge, and product familiarity also influence the explanation required.
Step 1: Choose One Conversion Goal
Before writing, decide what the video should accomplish. Is the next action:
- Buying a digital product?
- Starting a trial?
- Booking a qualified consultation?
- Requesting a quotation?
- Registering for a workshop?
For a direct purchase, measure completed transactions and retained revenue. For a consultation offer, track qualified bookings, attendance, and eventual customers. A video generating many unsuitable appointments can create work without generating value.
Practical output: Write one primary action and the financial outcome it supports.
Step 2: List the Questions Blocking That Action
Ask customers and review support enquiries. Typical questions include:
- Is this suitable for someone at my level?
- What exactly will I receive?
- Will it work with my existing tools?
- How much effort is involved?
- What does it cost?
- What happens if it is unsuitable?
- Why should I trust the seller?
Build the video around the questions that genuinely affect the decision. Avoid answering every possible question aloud. Detailed specifications, terms, and supporting information can remain available as readable page content.
Read Also: The Impact of Countdown Timers on Sales Pages: Urgency Metrics Analyzed
Practical output: Select the five questions your main video must answer.
Step 3: Write a Script That Earns Its Runtime
A practical VSL structure is:
- Identify the audience and problem.
- Show the solution.
- Explain how it works.
- Provide relevant evidence.
- Describe the offer and limitations.
- Invite the next step.
For a five-minute video, an illustrative outline might be:
| Section | Approximate allocation |
|---|---|
| Audience and problem | 30 seconds |
| Solution and demonstration | 90 seconds |
| Evidence or worked example | 60 seconds |
| Contents, suitability, and common questions | 90 seconds |
| Next step | 30 seconds |
Adjust the outline to the product. Read the script aloud. Remove repetition, long introductions, and sentences that add excitement without information.
Practical output: Record a rough version before investing in polished production.
Step 4: Make the Difference Between Versions Meaningful
If you want to test length, create two coherent versions. For example:
- A four-minute version with a concise demonstration.
- An eight-minute version adding a relevant example and answers to common objections.
Simply speaking faster does not create a fair short version. Neither does deleting essential information. The test will usually compare content packages of different lengths, rather than seconds alone. Acknowledge that when interpreting the result.
Practical output: Document exactly what differs between the versions.
Step 5: Measure the Entire Sales Page
Some visitors will buy without watching. Others will watch only part of the video. Your main comparison should therefore include everyone assigned to each page version.
| Metric | What it helps explain |
|---|---|
| Play rate | Whether visitors choose to watch |
| Early retention | Whether the opening earns attention |
| Viewing pattern | Where people leave, skip, or rewatch |
| Purchase rate per assigned visitor | Overall page performance |
| Refund-adjusted revenue per visitor | Revenue retained |
| Contribution per visitor | Value after defined variable costs |
Keep viewer-only results as supporting analysis. Viewers choose to watch, so they may differ from non-viewers before the video influences them.
A Worked Example: Four Minutes Versus Twelve Minutes
Consider a hypothetical $100 course.
| Result | Four-minute VSL | Twelve-minute VSL |
|---|---|---|
| Assigned page visitors | 5,000 | 5,000 |
| Video starts | 3,000 | 2,000 |
| Purchases | 100 | 125 |
| Purchase conversion | 2.0% | 2.5% |
| Initial sales | $10,000 | $12,500 |
| Fully refunded purchases | 5 | 10 |
| Revenue after refunds | $9,500 | $11,500 |
| Revenue after refunds per visitor | $1.90 | $2.30 |
The longer version generates fewer plays but more purchases. Its purchase rate is 0.5 percentage points higher, a 25% relative increase. However, the observed difference still needs an uncertainty assessment before declaring a winner.
Production, support, processing, and acquisition costs also affect profitability.
Step 6: Test Without Accidentally Changing Everything Else
Randomly assign eligible visitors and keep their assigned version consistent where possible. Maintain the same:
- Price and payment options.
- Headline and surrounding copy.
- Traffic sources.
- Checkout process.
- Purchase-button availability.
- Refund terms.
- Measurement window.
If one version hides the purchase button until the video ends, you are also testing a purchasing restriction. Set sample-size requirements and stopping rules beforehand. Allow enough time for delayed purchases and refunds.
A result can remain inconclusive. That is more useful than choosing a costly production direction based on noise.
Use Retention Data to Improve the Explanation
A drop-off can reveal a problem, but it requires interpretation.
| Viewing pattern | Possible explanation to investigate |
|---|---|
| Immediate exits | Opening does not match the visitor’s expectations |
| Drop during a long introduction | Too much background before useful information |
| Rewatching a demonstration | Useful detail or an unclear step |
| Skipping toward pricing | Visitors want commercial information sooner |
| Strong completion, weak purchases | Offer, trust, price, or checkout concerns |
Do not automatically remove every section preceding an exit. A buyer may leave the video to purchase. Connect viewing behaviour with page actions where your tools and privacy arrangements permit.
Adapt the Video to the Market and Offer
Consider these hypothetical applications:
| Market | Offer | Useful first comparison |
|---|---|---|
| United States | Freelance proposal templates | Two-minute overview versus five-minute demonstration |
| United Kingdom | Professional development course | Six-minute explanation versus twelve-minute version |
| Canada | Photography editing tools | Short before-and-after demonstration versus detailed walkthrough |
| Australia | Business consulting | Concise service introduction versus explanation with a worked example |
These are testing ideas, not verified case studies. Use language, examples, pricing, and scheduling information the intended audience understands.
Provide accurate captions and a readable summary. People should be able to evaluate the offer without relying entirely on sound or uninterrupted viewing.
Final Thoughts
The statistically optimal VSL length is specific to an offer, audience, and measured outcome. Broad video benchmarks can guide your first draft, but they cannot select the winner.
Explain the product clearly, test coherent versions, and measure purchases after refunds and relevant costs.
Keep every minute that helps customers decide. Remove the minutes that merely delay them.
FAQ
1. What is the best VSL length for conversions?
There is no universal best length. Start with the time needed to explain the offer clearly, then compare shorter and longer versions using actual customer outcomes.
2. Do short VSLs convert better?
Sometimes, particularly when the offer is familiar and easy to demonstrate. Higher completion alone does not establish higher sales.
3. Can a 20-minute VSL work?
Yes, when the audience needs and wants that level of explanation. A detailed demonstration or educational offer may justify it; repetition does not.
4. Which metric should determine the winning version?
Use contribution per assigned visitor where practical, supported by purchase and refund data. Play rate and viewing retention help explain the result but should not replace it.
Source: Vidyard,











Comments