
 By
Upselling and cross-selling can increase checkout revenue, but the gain depends on offer acceptance, the additional amount customers spend, and whether the offer affects completed purchases. A higher average order value does not automatically mean higher total sales—or higher profit.
For example, if 10% of 1,000 customers purchase a $15 add-on, you generate $1,500 in additional revenue. However, if presenting that offer causes enough shoppers to abandon their original purchases, the overall result can be negative.
The useful question is therefore: how much additional customer contribution does the offer create after accounting for lost orders, discounts, refunds, and delivery costs?
Here is how to measure the difference between upselling and cross-selling, interpret recent benchmarks, and estimate what your checkout could realistically earn.
What Is the Difference Between an Upsell and a Cross-sell?
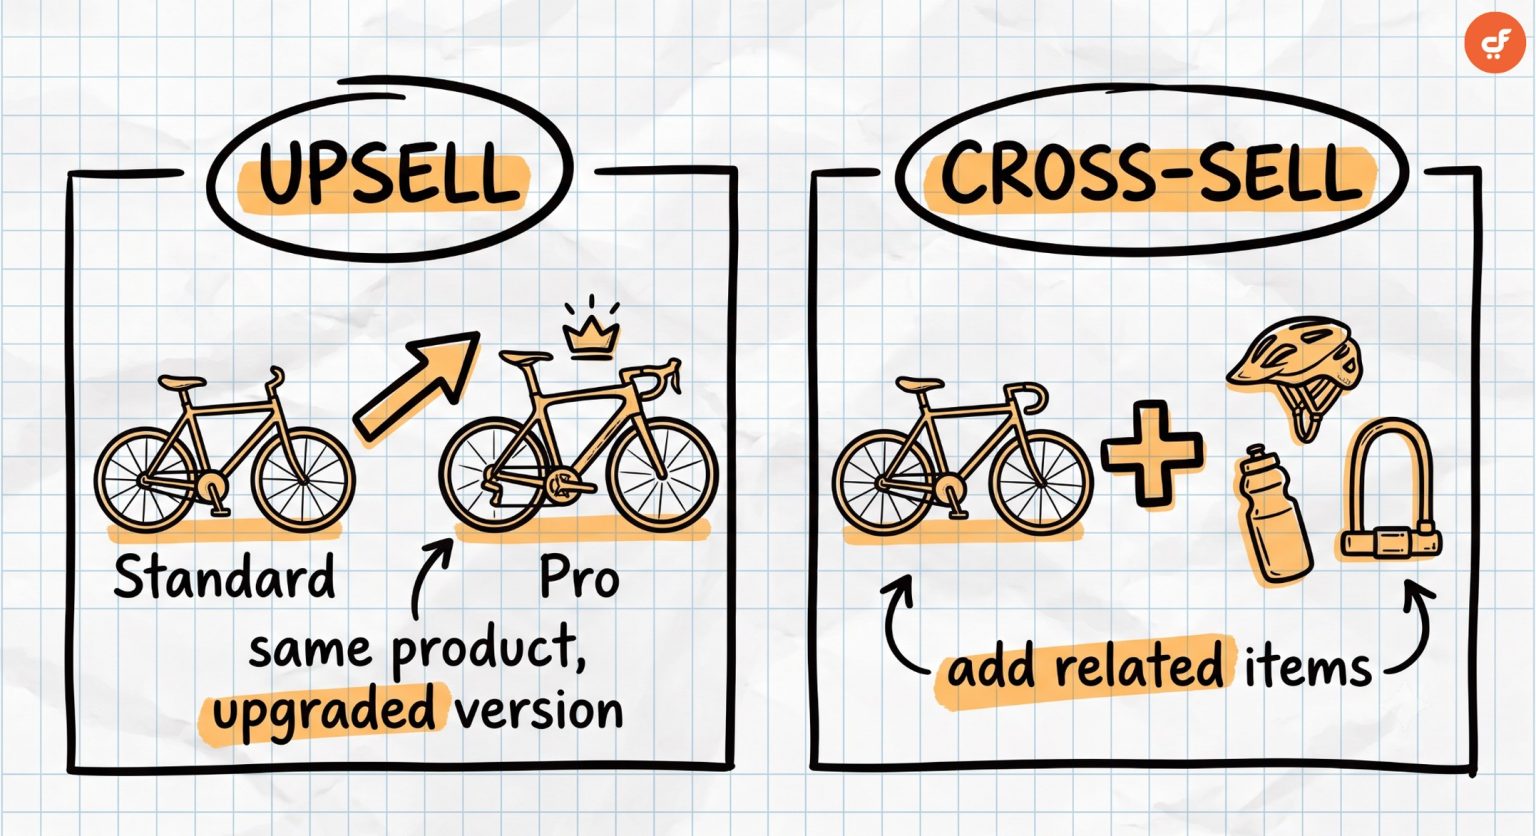
An upsell replaces the intended purchase with a more expensive version. A cross-sell adds a complementary product.
Suppose someone is buying a $30 digital guide:
| Strategy | Offer | Additional revenue if accepted |
|---|---|---|
| Upsell | Replace the guide with a $60 expanded edition | $30 |
| Cross-sell | Add a $15 workbook | $15 |
| Combined offer | Buy the expanded edition and workbook for $70 | $40 |
The distinction matters when measuring results. Selling the $60 edition does not create $60 in additional revenue if the customer would otherwise have purchased the $30 guide. The additional amount is $30.
Similarly, a $70 bundle may replace separate purchases the customer already intended to make. Its full selling price should not automatically be credited as new revenue.
What Recent Upsell Statistics Actually Show
Recent merchant data suggests that dramatic results are possible, but typical outcomes can be considerably smaller than promotional headlines imply.
Digismoothie’s 2026 merchant benchmarks
Digismoothie analysed Candy Rack activity across 3,199 Shopify stores, covering 218.6 million offer views between January and August 2026.
Its reported median attributed revenue uplift was 2.4% above sales excluding upsells. The upper-quartile threshold was 4.7%, while the top-decile threshold was 8.9%.
These figures cover several placements, rather than checkout alone. Median offer-view-to-sale rates included:
| Placement | Median take rate |
|---|---|
| Product-page pop-up | 2.4% |
| Cart pop-up | 1.9% |
| Slide-cart offers | 1.4% |
| Checkout placement on Shopify Plus | 0.4% |
| One-click post-purchase page | 0.3% |
This is vendor-reported observational data. The revenue measure attributes purchases to offers; it does not establish the additional revenue a randomised comparison would reveal.
Vitals’ October 2026 findings
Vitals examined 6,484 Shopify stores, with headline benchmarks restricted to 2,557 stores receiving at least 1,000 offer impressions.
For that higher-volume group, the median:
- Offer add-to-cart rate was 0.5%.
- Share of orders involving an offer was 4.8%.
- Share of revenue involving an offer was 5.3%.
Those measures are different. Revenue from orders containing an offer includes spending that may have happened anyway. As Vitals explains, “This is attribution, not a controlled test.” Its figures also combine offer types and placements, limiting direct checkout comparisons.
The Checkout Metrics You Need to Track
A useful dashboard separates customer actions from financial outcomes.
| Metric | Calculation | What it tells you |
|---|---|---|
| Offer acceptance rate | Paid offer acceptances ÷ eligible exposures | How frequently exposed shoppers purchase |
| Attachment rate | Completed orders containing the add-on ÷ eligible completed orders | How often the product accompanies a purchase |
| Average order value | Net sales ÷ completed orders | Average spending per order |
| Checkout completion rate | Completed orders ÷ checkout starters | Whether shoppers finish buying |
| Revenue per checkout starter | Net sales ÷ checkout starters | Combined effect of conversion and order value |
| Contribution per checkout starter | Sales minus defined variable costs, divided by starters | Commercial value after relevant costs |
Define the denominator carefully. An acceptance rate based on offer impressions cannot be compared directly with an attachment rate based on completed orders. One shopper may also see an offer repeatedly.
For testing, consistent customer or checkout-level exposure counts are usually easier to interpret than raw impressions.
How Much Extra Revenue Can a Cross-sell Generate?
Start with a simple estimate:
Additional cross-sell revenue = Eligible completed orders × Attachment rate × Add-on price
Suppose your store completes 1,000 eligible orders monthly, with an existing average order value of $50. You introduce a $15 workbook.
| Attachment rate | Add-on purchases | Additional revenue | Increase over $50,000 baseline |
|---|---|---|---|
| 5% | 50 | $750 | 1.5% |
| 10% | 100 | $1,500 | 3.0% |
| 20% | 200 | $3,000 | 6.0% |
These are hypothetical scenarios, not predicted acceptance rates. They assume the offer does not change checkout completion, existing product purchases, or refunds.
The table illustrates an important point: a seemingly impressive 20% attachment rate produces a 6% revenue increase when the add-on costs $15 against a $50 basket.
Read Also: Why Is My Business Revenue Not Growing? What to Check First
Acceptance and revenue uplift are different percentages.
How to Calculate Upsell Revenue Correctly
For an upgrade, count the price difference:
Additional upsell revenue = Completed upgrades × Difference between upgraded and original prices
Imagine a course store selling:
- Standard course: $100
- Premium course: $150
If 80 customers upgrade, the additional revenue is:
80 × ($150 − $100) = $4,000
It is not $12,000. That figure includes the $8,000 those customers would have spent on the standard course.
Now account for extra costs.
If each upgrade includes feedback costing $20 to provide, the added service expense is:
80 × $20 = $1,600
That leaves $2,400 in additional contribution, before extra processing fees, refunds, software, and other relevant expenses.
Digital upgrades can carry substantial costs when they include personal support, live sessions, or third-party services.
Why Higher Order Value Can Still Reduce Revenue
Consider a hypothetical checkout experiment with 1,000 checkout starters in each group.
| Metric | Original checkout | Checkout with cross-sell |
|---|---|---|
| Checkout starters | 1,000 | 1,000 |
| Completion rate | 60% | 57% |
| Completed orders | 600 | 570 |
| Average order value | $50.00 | $51.50 |
| Revenue | $30,000 | $29,355 |
Order value rises by 3%, yet revenue falls by $645, or 2.15%. The extra spending fails to compensate for fewer completed orders.
This is why average order value should be monitored alongside revenue and contribution per checkout starter.
Checkout interruption is a documented concern. Baymard’s research warns that recommendations requiring an additional accept-or-reject step can frustrate shoppers. In one specific Amazon checkout test, 66% of participants encountering that separate cross-sell step exhibited extreme frustration. That finding concerns the tested experience; it is not a universal abandonment rate.
Which Offers Are Most Likely to Make Sense?
Start with the customer’s task. A useful cross-sell makes the original purchase easier to use or more complete. A useful upsell provides benefits the customer can readily understand.
| Market | Hypothetical original purchase | Relevant offer |
|---|---|---|
| United States | Freelance proposal guide | Editable proposal templates |
| United Kingdom | Interview preparation course | Upgrade including a practice interview |
| Canada | Photography presets | Compatible editing tutorial |
| Australia | Business budgeting spreadsheet | Cash-flow forecasting workbook |
For physical products, compatibility matters just as much: the correct batteries, fittings, or protective case can be more useful than a popular unrelated item.
Baymard’s January 2021 cross-sell research found that 52% of benchmarked desktop sites presented cart recommendations that were irrelevant or based only on other customers’ purchases. The dated finding highlights a recurring design problem rather than describing today’s entire market.
Should You Offer Discounts?
A discount can increase acceptance while reducing contribution. Suppose an add-on sells for $20 and carries $5 in variable costs.
At full price:
100 purchases × $15 contribution = $1,500
With a 25% discount, the price falls to $15 and contribution becomes $10.
You now need:
$1,500 ÷ $10 = 150 purchases
That is 50% more purchases to maintain the same contribution, assuming unchanged costs and no other effects. Test the discounted offer against the full-price version. Do not assume a higher acceptance rate makes the discount worthwhile.
Also check whether customers receiving the offer would otherwise have bought the product later at full price.
How to Run a Useful Checkout Experiment
Test one meaningful change at a time. A straightforward approach is:
- Choose eligible customers. Specify products, devices, and markets.
- Randomly assign customers. Keep their experience consistent.
- Compare an offer against the existing checkout.
- Choose contribution per checkout starter as the primary financial measure.
- Monitor completion, refunds, support issues, and payment failures.
- Allow enough time for purchases and refunds to mature.
Set sample size and stopping rules before reviewing results. A handful of accepted offers provides weak evidence, especially when checkout conversion also varies.
Keep post-purchase offers separate in reporting. They occur after the initial payment and should not be mixed with offers shown before checkout completion.
Turn Extra Revenue Into an Honest Profit Estimate
Suppose testing indicates $2,000 in additional monthly net sales. Your financial assessment might look like this:
| Additional monthly item | Amount |
|---|---|
| Net sales attributable to the tested improvement | $2,000 |
| Product or service delivery costs | −$500 |
| Payment and transaction fees | −$80 |
| Software and maintenance | −$150 |
| Support and fulfilment labour | −$200 |
| Remaining contribution | $1,070 |
This illustrative calculation assumes refunds are already reflected in net sales.
If the change required $1,500 in initial development and creative work, payback would take approximately 1.4 months, provided the monthly contribution persists.
Include implementation effort and owner time when evaluating whether the improvement deserves continued investment.
Final Thoughts
Upselling and cross-selling can generate useful extra revenue, but the amount depends on customer relevance, offer pricing, margins, and checkout completion.
Start with one understandable offer. Measure the extra contribution against a checkout without it, and include refunds and delivery expenses.
The strongest result is an offer customers value that leaves the business earning more after costs.
FAQ
1. Is upselling more profitable than cross-selling?
Neither is consistently more profitable. An upgrade may generate more revenue per acceptance, while a complementary add-on may cost less to deliver. Compare additional contribution across eligible customers.
2. What is a good checkout offer acceptance rate?
There is no universal target. Placement, price, audience, and measurement definitions materially affect the rate. Use comparable benchmarks and your own controlled results.
3. Can checkout offers reduce sales?
Yes. Confusing or intrusive offers can reduce checkout completion enough to outweigh additional spending. Track revenue and contribution per checkout starter.
4. How many offers should I display at checkout?
Start with one clearly relevant offer and test from there. Make it easy to decline, show the additional price clearly, and preserve a straightforward path to payment.
Source: digismoothie.com, Baymard Institute











Comments