
 By

To track revenue growth performance, subtract revenue from the previous period from current-period revenue, divide by the previous-period revenue, then multiply by 100. That gives you the percentage change for the period, but the headline figure alone won’t show which products, customers, or channels are driving it. Segment the results to see where growth is building and where it’s losing momentum.
Revenue can rise even as a key product slows, or dip when a seasonal business follows its usual pattern. A useful tracking process puts each change in context instead of treating it automatically as a win or a warning.
This guide explains what revenue growth means, which metrics reveal its drivers, and how dashboards and reporting tools bring sales and marketing data together. You’ll also learn how to build a reliable process to track revenue growth performance, connect indicators to revenue outcomes, and make clearer decisions about where to focus next.
Key Takeaways
- Separate revenue from new customers, repeat buyers, upsells, and cross-sells to pinpoint which sources are driving change.
- Build dashboards that connect leading indicators, such as pipeline activity, to revenue outcomes.
- Choose quarter-over-quarter or year-over-year comparisons based on the decision you need to make and the effect of seasonality.
- Use MRR, ARR, customer lifetime value, and net revenue retention to examine recurring income and customer value from different angles.
- Focus your tracking process on the metrics that explain your biggest current revenue challenge instead of measuring everything at once.
What is revenue growth?
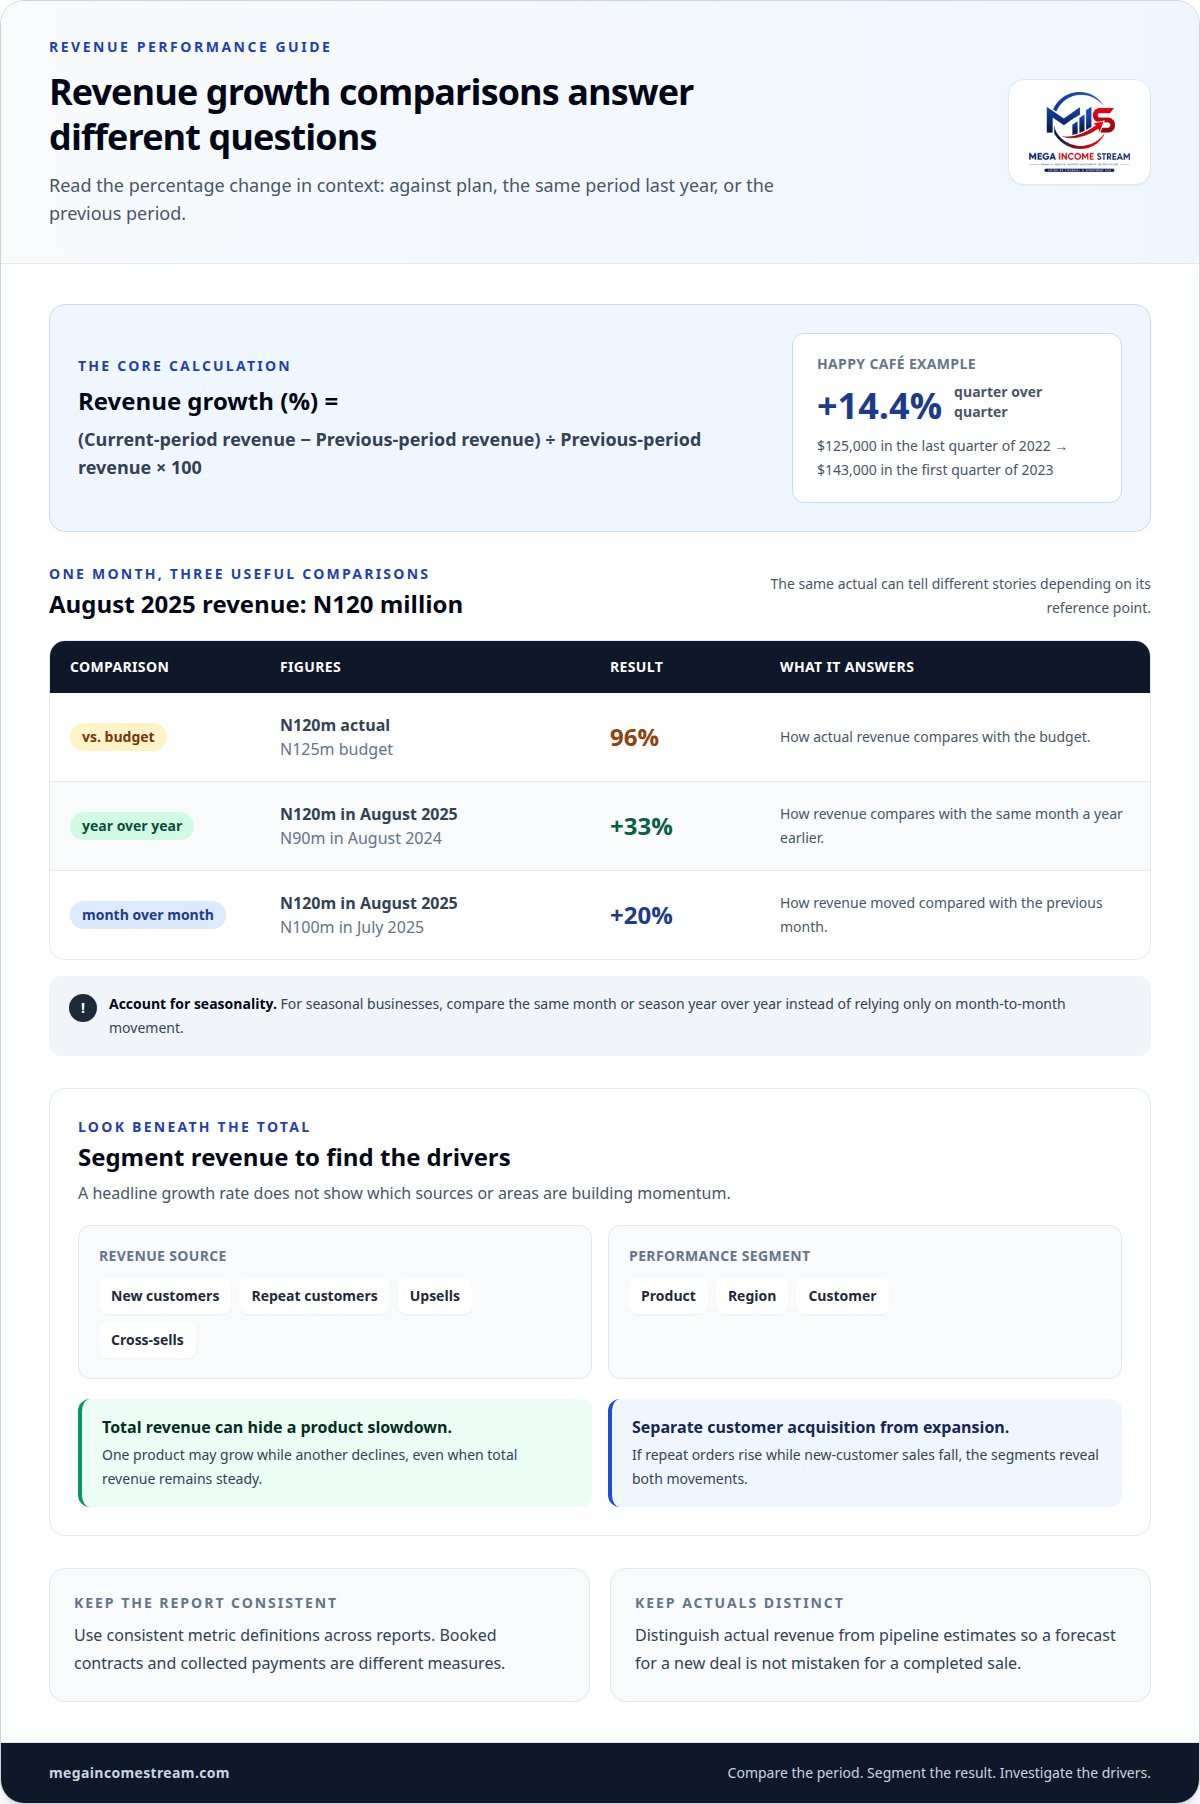
Revenue growth measures how sales change between periods. To calculate it, subtract previous-period revenue from current-period revenue, divide by previous-period revenue, then multiply by 100.
For example, The Happy Café’s revenue rose from $125,000 in the last quarter of 2022 to $143,000 in the first quarter of 2023, a 14.4% quarter-over-quarter increase. Segmenting that result shows which customers, offers, and markets contributed to the change.
Revenue sources and customer expansion
Break revenue sources into sales from new customers, repeat customers, upsells, and cross-sells. This shows whether growth comes from attracting buyers or expanding existing relationships.
A subscription business might track new accounts separately from upgrades to higher plans. A retailer could distinguish repeat purchases from customers adding a complementary product. Compare each source with its target, then relate it to sales, marketing, and customer success activity. If repeat orders rise while new-customer sales fall, teams can adjust acquisition efforts without overlooking customer loyalty.
Performance across products and markets
Segment revenue by product, region, and customer to see where growth is concentrated and where it is weakening. Compare each product’s sales across markets, then isolate customer groups with different buying patterns.
For example, one product may grow while another declines, even as total revenue remains steady. Regional results can also vary: customer growth in North Carolina was 34% this year, with most growth around Raleigh and Charlotte. Track these segments alongside the period total to direct inventory, marketing, and sales capacity toward the strongest opportunities.
Organic growth and growth drivers
Organic growth comes from existing operations, while acquisitions add revenue through purchased businesses. Price increases can also raise sales without increasing customer volume. Separate these effects in reports to see whether underlying demand is expanding.
Revenue performance can improve through new customers, repeat purchases, better conversion, upsells, or cross-sells. It can weaken when customers churn, demand falls, or the product mix shifts toward lower-priced offers. Consider sales efficiency alongside revenue, so you can assess the activity and resources that produced it. Customer success contributes through renewals and expansion signals such as product adoption, continued purchases, and interest in additional services.
Customer value and growth planning
Customer lifetime value estimates the revenue associated with a customer relationship over time. The Happy Café’s estimated customer lifetime value is $866.64, based on six purchases per year over an average customer relationship of four years. Compare this measure across customer segments to identify which relationships contribute more recurring value.
Forecast revenue by combining recent sales trends with expected renewals, customer expansion, new-customer activity, and known seasonal patterns. For seasonal businesses, compare the same month or season year over year instead of relying only on month-to-month movement. Set targets against relevant historical performance and market conditions, then measure actual results against them. This ties forecasts to identifiable drivers rather than an unsupported growth ambition.
Automated revenue reporting and dashboards
Automated reporting brings revenue data into repeatable reports, reducing manual consolidation across sales and finance. Dashboards turn those reports into comparable trends and performance signals.
Automated revenue reporting
Automated revenue reporting collects and refreshes figures from connected business systems, then organizes them into recurring reports. This reduces time spent copying figures and leaves teams more time to investigate changes.
Start with a consistent revenue source, such as recognized sales data from the accounting system. Connect it to sales and marketing records only when the fields can be matched reliably. Distinguish actual revenue from pipeline estimates, so a forecast for a new deal is not mistaken for a completed sale.
Set a reporting cadence that fits the decision. A monthly close can support financial review, while a more frequent sales view can flag changes in active deals. Keep metric definitions consistent across reports. If one team counts booked contracts and another counts collected payments, their totals will not reconcile, even when both systems update automatically.
Revenue dashboard design
A revenue growth dashboard displays key measures together, while a RevOps dashboard connects leading indicators with revenue outcomes. That connection helps teams see whether activity is translating into commercial results.
For example, a dashboard can show closed revenue alongside pipeline movement, conversion trends, and renewals. Add filters for product, region, and customer segment so the total does not conceal a decline in one area. Label actuals, targets, and forecasts clearly. Each view should answer a decision, such as where sales capacity can support expansion.
An August 2025 example shows how comparisons add context: revenue of N120 million reached 96% of the N125 million budget. The same result was 33% higher than August 2024 revenue of N90 million, and 20% above July 2025 actual revenue of N100 million. Each comparison answers a different question: budget attainment, annual trend, or recent movement.
Financial statements and analytics dashboards
Financial statements provide the accounting view of revenue, while analytics dashboards help examine the patterns behind it. Use the income statement as the financial reference, then compare its revenue figures with channel, product, or customer analytics.
To track growth, align the dashboard’s reporting period and revenue definition with the financial statement. Compare the current period with the previous period or the same period in the prior year. If analytics show a channel rising while reported revenue stays flat, investigate timing, attribution, and whether the channel’s activity resulted in completed sales.
This approach makes reporting useful for financial control and operational decisions. Finance can monitor whether dashboard totals reconcile with recorded revenue, while RevOps connects leading indicators to outcomes. Keep the source, period, and metric definition visible in each report. This makes trends easier to interpret and supports efficient review without mistaking activity for success.
CRM, analytics, revenue intelligence, and business intelligence tools
CRM, analytics, revenue intelligence, and business intelligence tools each reveal a different part of revenue performance. A CRM records customer and sales activity; analytics examines patterns; revenue intelligence connects sales signals; and business intelligence combines data for broader analysis. Use them together only when their measures share clear definitions and reporting periods.
A CRM can organize opportunities, customer history, renewals, and sales outcomes. Revenue intelligence tools add context by connecting interactions and pipeline movement with closed revenue. Analytics tools can then compare results by channel, product, or customer group. Since 89% of RevOps professionals define measuring metrics as core to their role, selecting indicators that support a specific decision matters more than collecting every available field.
Business intelligence tools support exploratory analysis by helping teams investigate performance from different angles. Start with a revenue change, then segment it by product, region, channel, or customer cohort. If one segment declines during a quarter, compare its conversion, order size, and repeat-purchase patterns. This helps identify possible drivers without treating a single top-line movement as a complete explanation.
Pricing analytics can expose margin leaks hidden by stable or rising sales. Compare realized prices, discounts, product mix, and delivery costs, then review gross profit by offer or customer segment. If gross profit percentage drops by 2-3%, investigate the change in discounting, costs, or product mix. McKinsey reports that a 1% improvement in price leads to an average 8.7% improvement in operating profits, showing why price execution can matter beyond sales volume.
Retention and cohort analysis reveal whether customer relationships continue generating revenue after the first purchase. Group customers by signup or acquisition period, then measure repeat activity and revenue across later periods. Retention generally needs 90 days to show a pattern, so short snapshots can misread early customer behavior. A cohort comparison can also show whether newer customers renew or expand at a different pace from earlier groups.
Choose each tool according to the business question it answers. To investigate renewals, combine CRM renewal records with cohort retention indicators. To assess margin pressure, connect pricing and cost data to profit by product. To forecast sales, review pipeline movement alongside realized revenue. Seasonal businesses should compare the same month or season year over year; a quarter-over-quarter view alone may mistake normal seasonal movement for a structural change.
Keep the analysis tied to an operational decision. A pricing review may uncover inconsistent execution, which can account for 2-5% of annual revenue. A retention review may show whether customer success activity supports renewals or expansion. Record the metric definition, source system, and reporting period for each analysis, so teams can compare results consistently and act on the indicators that explain the current revenue issue.
Revenue growth metrics: MRR, ARR, CLV, and NRR
Revenue growth metrics show whether sales are recurring, customer relationships are expanding, and acquisition activity converts efficiently. Pair each measure with its comparison period and business stage to make results useful.
Recurring revenue and customer value measures
MRR measures monthly recurring revenue, ARR expresses recurring revenue annually, CLV estimates customer value over a relationship, and NRR tracks recurring revenue retained from existing customers, including expansion and losses. Together, these metrics show whether growth comes from durable customer revenue.
For subscription businesses, ARR equals MRR multiplied by twelve. In an illustrative monthly breakdown, $42,000 in new MRR and $18,000 in expansion MRR offset $15,000 in churned MRR and $6,000 in contraction MRR, producing $39,000 in net new MRR. NRR adds context by measuring existing-customer revenue changes without new-customer revenue. Compare it with CLV to assess how retention and expansion shape customer value.
Growth metrics by company stage
Metrics by company stage should focus on the constraints that matter most. An early-stage company may prioritize customer acquisition, funnel conversion, and initial retention. A more established subscription business can examine NRR, renewals, and expansion revenue.
Conversion rates show the percentage of prospects who move between funnel stages. Measure each step, such as visitor-to-lead, lead-to-opportunity, and opportunity-to-sale, to find drop-offs before investing more in acquisition. A business with a mature customer base can pair those indicators with renewal and expansion measures. Choose metrics based on whether the current bottleneck is demand, sales execution, or customer retention.
Revenue growth rate calculations
Year-over-year and quarter-over-quarter growth use the same calculation, but compare different periods. Subtract the earlier period’s revenue from the current period’s revenue, divide by earlier revenue, then multiply by 100 to get the percentage change.
For year-over-year analysis, compare the same period across consecutive years; for quarter-over-quarter analysis, compare adjacent quarters. Companies commonly use annual growth to assess longer-term trends, while quarter comparisons help evaluate short-term activity. Seasonal businesses should compare matching periods because adjacent quarters may reflect normal seasonal shifts. Keep revenue definitions consistent across both periods for an accurate result.
Benchmarking revenue growth
Benchmarking compares growth with relevant industry measures or competitors to assess relative performance. Select businesses with similar markets, revenue models, and maturity, then compare the same metric over the same period.
A healthy annual growth rate is roughly 20 to 30 percent, while top-quartile performers grow by more than 50 percent. These figures provide context, not a universal target: some companies may regard 4% as a major success, while others target 50%. Compare like with like, then use differences in acquisition, retention, and expansion to identify where performance diverges.
Building a revenue tracking process
A reliable tracking process links consistent revenue data to a specific business decision. RevOps teams should choose metrics that explain their biggest current revenue problem instead of trying to track everything at once.
- Define the decision. Start with a question the team needs to answer, such as whether renewals are weakening or a sales channel is underperforming. Choose indicators that explain that issue. For a renewal concern, review retained revenue and customer activity; for a channel concern, compare attributed revenue with channel costs.
- Set one revenue definition. Align finance, sales, and marketing on what counts as revenue and which period each report covers. Keep booked, collected, and forecast revenue separate. This prevents a new sales opportunity from appearing as completed revenue and helps reports generate comparable results across teams.
- Map the data sources. Connect accounting records with relevant CRM and marketing data, then document which system supplies each metric. Revenue tracking software can centralize sales and marketing channel data to support forecasting. Match shared fields, such as customer and transaction identifiers, before combining reports.
- Choose focused measures. Select a small set tied to the current question, then segment results by product, region, customer type, or channel when those dimensions explain performance. A channel review, for example, can compare sales generated with the associated channel costs to assess profitability.
- Set the review rhythm. Use monthly or annual sales data to identify trends and shifts in customer spending. Review near-term indicators alongside realized revenue, then record the decision and the metric that prompted it. This makes the next review a test of whether the action changed the outcome.
Keep the process consistent as the business grows. If a team changes its revenue definition, mark the change in reporting. Otherwise, a new result may look like a trend when the calculation has changed. For seasonal sales, compare the same month or season year over year rather than relying only on adjacent periods.
Use tracking results to create forecasts, allocate resources, and plan the next review. Compare actual revenue with the forecast, then investigate any gap by segment and source. If one product line misses its target while another grows, separate the results before changing budgets. Identify what is driving performance, then base the next decision on that evidence.
Make the process competitive through disciplined iteration, not by adding more metrics. Keep the decision, source, calculation, and review cadence visible to everyone using the report. When the current revenue problem changes, revisit the selected measures and replace those that no longer explain it. A focused tracking system turns each reporting cycle into a clear decision point. For help deciding whether outside expertise or internal leadership is the right resource for strategy work, see this comparison of business consultant or in-house strategy.
Mega Income Stream
Mega Income Stream helps entrepreneurs connect revenue metrics to practical decisions through Business Strategies, Making Money Insights, and its Consulting Business. If your dashboard shows growth but does not explain which customers, channels, or offers are driving it, a structured review can help identify the gap and focus the next business decision.
Turn to Mega Income Stream when you need to clarify which measures matter, interpret revenue patterns, or develop a more consistent tracking process. The aim is to make performance data useful for planning sustainable income streams, not simply add more numbers to a report.
Contact Mega Income Stream to discuss your revenue tracking questions.
Turn measurement into your next growth decision
A tracking system is valuable when it changes how the business allocates attention. Assign an owner to each important metric, then define which decision its movement should prompt. This keeps reporting connected to execution rather than letting dashboards become passive records.
Build a review habit around the questions your business needs to answer next. If customer revenue shifts, examine which segment changed and what action could address the cause. If a forecast misses, refine the assumptions behind it. To track revenue growth performance over time, preserve consistent definitions while updating the questions as your strategy evolves.
Mega Income Stream can help turn performance data into practical business decisions. Explore your next revenue growth strategy and move forward with a clearer plan.
Frequently Asked Questions
How do you measure revenue effectively?
Start with a transaction-level reconciliation between sales records and the accounting ledger. Check for duplicate entries, refunds, credits, and transactions assigned to the wrong period. For international sales, preserve the original currency and document how exchange rates are applied before combining totals. These checks help explain differences between operational reports and recorded revenue, so decisions rely on consistent inputs rather than unexplained variances.
What is Revenue Tracking?
Revenue tracking means maintaining a traceable record of business income and its underlying transactions. A useful record links each transaction to details such as product, customer, channel, and date. For example, a digital publisher can tag affiliate commissions by campaign. Those tags make reviews more specific and help trace reported results back to the activity that generated them.
What is the purpose of a revenue dashboard?
A dashboard helps teams spot exceptions and investigate them without rebuilding a report for every question. For example, a sales manager could use a flagged variance to open the affected product or customer view, then identify the records behind it. Separate views for executives, finance, and sales can keep each audience focused on relevant decisions while using shared metric definitions.
Which KPIs best measure revenue growth performance?
Choose KPIs that show revenue quality as well as operational constraints. Contribution margin can reveal whether added sales support profit, while customer concentration can expose dependence on a narrow group of accounts. Forecast variance can show where planning assumptions repeatedly miss actual results. Pair an outcome measure with a diagnostic measure, then use both to identify what needs investigation instead of expanding the dashboard without a clear purpose.
What is a good revenue growth rate by industry and company size?
A useful target depends on the revenue model, business maturity, sales capacity, and market conditions. A smaller business may have different growth opportunities and constraints from an established company in the same industry. Compare a rate only with businesses using similar definitions and periods. Also account for one-time deals, inflation, and currency movement, which can affect reported growth without indicating stronger underlying demand.
What are common revenue growth measurement mistakes and risks?
Common risks include counting one sale in multiple systems, treating a one-time contract as recurring income, and assigning revenue to a campaign without a consistent attribution rule. Currency conversion can also distort comparisons if the reporting basis changes between periods. Limit access to sensitive customer-level data, document adjustments, and retain a record of corrections. These controls make unusual results easier to explain during reviews.
What tools and software help track revenue growth performance?
Choose software by testing whether it connects the records needed to answer a specific decision. Confirm transaction identifiers match across systems, reporting periods align, and users can export data for reconciliation. A spreadsheet may be enough for a simple operation; connected reporting becomes more useful as channels and teams multiply. Test the workflow with a small set of transactions before relying on automated totals.










Comments