
 By
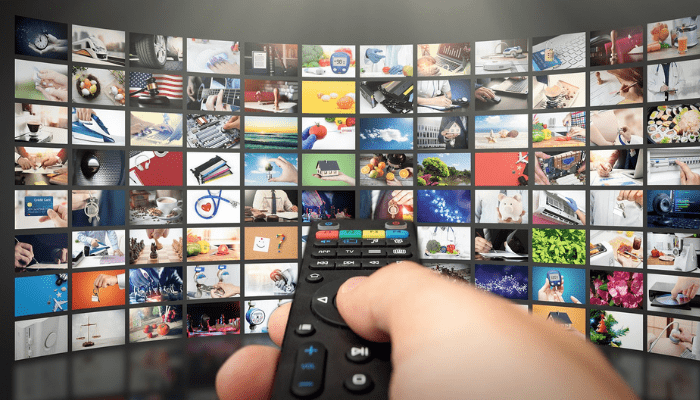
Streaming platforms’ economics are dependent on revenue from various business models, such as subscriptions (SVoD), advertising (AVoD), or a combination of the two, and are frequently measured using measures such as subscriber value, content ROI, and churn. Their business models capitalize on the digital economy by offering a platform for content delivery, and success is determined by a company’s ability to gain and maintain users via content and pricing tactics.
According to a 2015 Nielsen estimate, more than 40% of US homes have access to video streaming services. In addition, 13% of households subscribe to multiple streaming services. If you use Netflix, Hulu Plus, or another popular streaming service, you are not alone. Let’s take a closer look at the growth of video streaming services and what it implies for the future.
Currently, almost two in every five households use a video streaming service. Video streaming services are more popular. According to valuation firm PricewaterhouseCoopers, “streaming is one of the fastest-growing consumer sub-segments and is projected to reach $10.1 billion in 2018, up from $3.3 billion in 2013, at a 24.8 percent CAGR [Compound Annual Growth Rate] in the U.S.”
By 2017, the total revenue from TV video on demand and subscription streaming services is predicted to exceed that of the country’s movie theater box offices.
Streaming services either acquire content license rights or create their own content. They then distribute that content to customers, typically via a monthly subscription model. In other words, streaming services do not rely on advertising to generate revenue.
The exception is Hulu Plus’ lowest-priced option, which includes a limited number of commercials. In general, however, subscriptions are pitched as a viable alternative to both watching advertisements and pirating content.
You most likely associate “streaming service” with Netflix. According to Nielsen, 36% of all U.S. homes with TVs have a Netflix account, compared to 13% who have streaming access through Amazon Prime and 6.5% through Hulu Plus.
Netflix began in the United States but has now grown to become a global force. By the end of 2016, the company plans to be available in 200 countries. In 2015, the streaming service expanded to Japan, Spain, Italy, Cuba, Australia, and New Zealand, among others. The company’s shares increased by 138%.
Netflix isn’t the only game in town, though. Google has launched YouTube Red, a subscription streaming service. For $9.99 per month, users can watch YouTube videos without advertising. They will also have access to original YouTube TV shows, music, and gaming.
The present landscape of streaming services relies heavily on original content. Consider the case of Netflix. Netflix was able to make itself necessary to more consumers, raise its brand, and become more than just a clearinghouse for other people’s video material with shows like “Orange is the New Black” and “House of Cards”.
How We Stream
If you’re a millennial, you might think of a streaming service user as someone who has a laptop (and possibly a projector) but no television. This may be true for some Americans, however the majority of “Streaming Video on Demand” (SVOD) households own a television.
According to Nielsen, “Homes with subscription streaming services have both a penchant for TV-connected technology and, perhaps more importantly, display the greatest usage of these devices — nearly 50 minutes more than a typical TV home.” In other words, streaming service subscribers watch more TV.
They are also more technologically advanced households. 95% of SVOD households have an HD display for viewing, compared to 88% of TV-only homes. 58% of SVOD households own a DVR, compared to 49% of TV-only households. 49% of streaming service homes have more than one computer, compared to 34% of TV-only households.
The difference in tech saturation between streaming service households and TV-only households may indicate a link between streaming service membership and overall household wealth.
Streaming Services and the Personal Budget
According to Parks Associates study, “over one-third of video consumed per week is OTT, but it represents only 9% of the household video budget.” (“OTT” refers to over-the-top content, or material supplied via the internet.) Streaming services are reasonably priced, especially if you stick with just one (or use a shared password – we’ll get to that later).
As of present, the price range for video streaming services is very limited. The lowest-cost option on Netflix is $7.99 per month, but most people choose the $9.99 option because it does not limit users to a single device. Hulu’s lowest-cost option is similarly $7.99, but it contains less advertisements. A commercial-free subscription is $11.99 per month. HBO Now, HBO’s stand-alone streaming subscription, costs $14.99 monthly.
What about the Amazon Prime video service? Amazon’s economic approach is a little different. Amazon Prime membership costs $99 per year and includes the company’s well-known free shipping. That subscription includes unlimited access to Amazon’s video streaming service for movies and television, including the critically acclaimed series “Transparent.”
Want access to more live TV? You might be interested in Sling TV. A $20 monthly Sling TV membership grants you live access to networks such as AMC, the Food Network, TNT, ESPN, and more. If you’re a regular CBS viewer, you can gain access to current (and some past) episodes for $5.99 per month. Showtime provides something comparable for $10.99 per month. Acorn TV offers a lineup of new and old British television favorites for $4.99 per month.
Once you’ve decided on the greatest streaming service in terms of content, you’ll need to discover a suitable price match. whether you routinely shop in quantity on Amazon and would benefit from free shipping with a $99 Amazon Prime subscription, you could always start there and see whether there’s enough video streaming to fulfill your demands.
Whether you use one streaming service or a combination of two or three (or more!), you’ll almost likely pay less per hour of video content than if you had cable or went to the movies. According to The Hollywood Reporter, the average price of a movie ticket in the United States is $8.61, an all-time high.
You could spend $7.99 on Netflix’s cheapest option or purchase one average-priced movie ticket per month. Of course, going to the movies is completely different from watching Netflix on the couch, but the price argument speaks for itself, especially if you’re looking to save money.
Even millennials, known for their desire for free entertainment, are embracing streaming services. Deloitte expects that the average millennial’s SVOD consumption increased by $40 in 2015. In the United States, 43% of those aged 18 to 34 subscribe to streaming services.
Understanding the Cost-Quality Trade-Off
CDN bandwidth is a major cost issue for streaming. It has a direct correlation with the amount of data transmitted to viewers. Simply simply, the higher the viewer engagement and stream quality, the more bandwidth is required, resulting in higher prices. As the worldwide CDN business expands, so will the demand for bandwidth.
Equally crucial are the prices of cloud storage. This refers to storing video files, metadata, and other materials. As multimedia collections grow, storage costs can quickly rise, particularly for high-resolution formats such as 4k. Understanding the price of CDN services is critical for developing efficient pricing strategies for streaming platforms.
Then there are encoding expenses, which result from the processing resources required to encode video files into various bitrates and formats. The intricacy of the encoding procedure and the number of output renditions have a direct impact on these expenditures.
Beyond this, operational overhead includes costs for staffing, monitoring, and maintaining the streaming infrastructure. These costs increase with the platform’s size and complexity. As a result, keeping track of these charges is critical for maintaining a balance in streaming platforms’ cost and revenue analyses.Then there are encoding expenses, which result from the processing resources required to encode video files into various bitrates and formats. The intricacy of the encoding procedure and the number of output renditions have a direct impact on these expenditures.
Beyond this, operational overhead includes costs for staffing, monitoring, and maintaining the streaming infrastructure. These costs increase with the platform’s size and complexity. As a result, keeping track of these charges is critical for maintaining a balance in streaming platforms’ cost and revenue analyses.
While cost management is critical, so is ensuring that viewers have the best possible Quality of Experience (QoE). Startup time, rebuffering ratio, and resolution consistency are three key QoE parameters that influence viewer retention. If the startup time, or the time it takes between a viewer commencing a stream and the video beginning to play, is too long, it can cause viewer frustration and abandonment.
Read Also: How AR/VR Are Shaping Consumer Behavior
The rebuffering ratio, which represents the percentage of total viewing time spent waiting for the video to buffer, is another important QoE indicator. High rebuffering ratios degrade the viewing experience and may cause viewers to disengage.
Resolution consistency ensures that viewers receive the best possible video quality based on their device and network conditions. Frequent quality variations or extended periods of low-resolution playback might significantly harm the viewer.
It’s also vital to understand how bad QoE affects income. Churn, or the pace at which viewers discontinue using a streaming service, is directly proportional to the quality of the viewing experience. Poor QoE can result in increased churn rates, as dissatisfied viewers are more inclined to cancel their subscriptions or migrate to competitors. Reduced engagement occurs when consumers watch less content because of quality difficulties. This results in fewer ad impressions or lower subscriber retention, ultimately lowering income.
The cost and revenue analysis of streaming platforms demonstrates that both costs and viewer experience must be managed efficiently. A well-optimized CDN provides viewers with a flawless and secure streaming experience, increasing engagement rates and income. Understanding these trade-offs will remain a top priority for platforms seeking to deliver high-quality experiences while managing infrastructure costs as we move forward in the streaming age.
Breaking Down Infrastructure Costs in Streaming
Let us go deeper into the cost and revenue analysis of streaming platforms, focusing on the primary cost drivers in video delivery pipelines. These costs include origin fetches, transcoding, and worldwide content distribution, all of which have their own ramifications and complications.
Origin Fetches, Transcoding, and Global Content Distribution
Origin fetches occur when the CDN retrieves material from its original storage location. The frequency of these fetches can result in greater charges, particularly for popular material or during peak viewing hours. These fees can have a substantial impact on the profitability of streaming platforms, especially those with vast and diversified content collections.
Transcoding is another crucial step in the video distribution pipeline. It entails transforming video data to various bitrates and formats to accommodate diverse devices and network situations. The computer resources required for transcoding increase the overall infrastructure costs. As streaming services serve a more varied audience, the need for efficient and high-quality transcoding solutions is greater than ever.
Global content distribution, or the replication of video files among various CDN servers across the world, is critical to providing viewers with low-latency access. However, the storage and bandwidth expenses associated with global distribution might be high. As streaming platforms strive to distribute content to audiences all over the world, managing these charges becomes an essential component of their cost and revenue analysis.
Regional Cost Disparities in Streaming Economics
Streaming economics is also influenced by regional cost differences. CDN pricing varies by region, with some places costing more to service than others. Regional cost disparities are driven by network infrastructure, data center availability, and local market conditions.
For example, distributing material to viewers in places with inadequate connectivity or high data transfer costs can have a substantial influence on total streaming economics. These problems highlight the need of a strong CDN strategy that manages expenses while delivering high-quality content. Because CDN price differs by provider owing to a variety of circumstances, recognizing regional cost discrepancies is critical for optimizing content delivery strategies and successfully controlling infrastructure spending.
As we examine the cost and revenue analysis of streaming platforms, it becomes evident that infrastructure expenses have a substantial impact on the overall economics of streaming. Understanding these costs and their drivers enables streaming platforms to better allocate resources, manage budgets, and, ultimately, provide a better viewing experience.
Strategies to Reduce Costs Without Sacrificing QoE
Now that we’ve identified the primary costs in the streaming pipeline, let’s explore strategies to optimize these costs while maintaining an exceptional Quality of Experience (QoE). In the cost and revenue analysis of streaming platforms, it’s essential to strike a balance between cost-efficiency and viewer satisfaction.
Caching Optimization Techniques
Effective caching can significantly reduce origin fetches and, in turn, lower costs. The key lies in understanding viewer behavior patterns and content popularity. With this knowledge, you can determine the optimal caching strategies for your platform.
You can further enhance cache efficiency by utilizing advanced caching algorithms and techniques, such as multi-tiered caching and dynamic content prefetching. These techniques can significantly improve cache hit ratios and minimize the need for origin fetches. Therefore, it’s beneficial to regularly monitor and fine-tune cache settings, ensuring that you’re not spending unnecessary resources on origin fetches.
Multi-CDN Deployment
Exploring multi-CDN deployment can also yield cost savings. By evaluating the pricing models and performance characteristics of different CDN providers in target regions, you can select the most cost-efficient CDNs for specific regions while maintaining reliability.
A multi-CDN strategy routes traffic to the most cost-effective CDN based on factors like viewer location, content type, and network conditions. This approach requires continuous monitoring and adjustment of the multi-CDN configuration to optimize cost savings without compromising on quality or reliability.
Leveraging Edge Computing
Edge computing is another promising strategy to reduce costs. By deploying video processing and personalization tasks at the edge—closer to end-users—you can minimize long-haul traffic and reduce the need for costly data transfers between origin servers and CDN nodes.
Edge computing platforms can perform tasks like transcoding, packaging, and ad insertion, reducing the load on central infrastructure. Plus, edge computing’s low-latency capabilities can deliver interactive and personalized viewing experiences while optimizing costs.
Efficient Encoding Techniques
Adopting efficient encoding techniques, such as advanced codecs like AV1, can lower bandwidth requirements and thereby reduce costs. But it’s crucial to evaluate the trade-offs between encoding efficiency and computational complexity when selecting codecs.
Implementing adaptive bitrate streaming can deliver the optimal video quality based on viewer device capabilities and network conditions. This approach requires continuous monitoring and adjustment of encoding settings to strike the right balance between quality and bandwidth consumption.
These strategies offer practical ways to optimize the cost and revenue analysis of streaming platforms. By focusing on efficiency at every stage of the video delivery pipeline, streaming platforms can significantly reduce costs without sacrificing the viewer’s Quality of Experience.
Metrics-Driven Cost Management in Streaming Platforms
Streaming platform cost and revenue analysis relies heavily on metrics-driven cost control. By comparing Quality of Experience (QoE) measurements to cost data, you may discover inefficiencies and optimize resource allocation. This method ensures that your investment in infrastructure, content delivery tactics, and resources is in line with your desired viewing experience.
Correlating QoE Metrics with Cost Data
It is critical to have a thorough monitoring architecture that captures both quality of experience indicators such as startup time and rebuffering ratio, as well as cost data such as CDN bandwidth and storage, in real time. Analyzing the relationship between QoE indicators and cost factors allows you to find places where adjustments can result in cost savings without sacrificing viewer experience. These data-driven insights are extremely useful for making informed decisions about your streaming platform’s infrastructure investments and resource allocation.
Utilizing Real-Time Analytics
Real-time analytics are critical for managing expenditures during high consumption periods. Implementing real-time monitoring and alerting systems enables you to track critical performance indicators and cost metrics during peak traffic periods. Furthermore, machine learning algorithms can help predict consumption trends, allowing you to scale resources proactively to meet demand while keeping prices low. This constant monitoring and adjustment of resource allocation in real time ensures optimal performance and cost effectiveness.
The Limits of the Streaming Model: Bandwidth
During peak hours, Netflix consumes nearly 37% of all internet bandwidth in the United States. Netflix and YouTube account for around half of all internet traffic. Streaming services’ economic model is limited by their bandwidth-intensive nature.
This holds true at both the individual and national levels. Individuals and households may choose not to purchase streaming service subscriptions because their home internet is insufficiently fast or because their mobile data plans are too restrictive to make video streaming cheap on mobile devices. Countries with lower average internet speeds may not be suited for SVOD.
It’s no surprise that Netflix has revealed plans to help users use up to 20% less data while maintaining video quality. Bandwidth is a significant constraint for all video streaming, particularly mobile streaming, because many consumers have restricted data plans.
According to a recent Economist report, “Video gobbles up so much data that by 2018, it is likely to account for 80-90% of global consumer internet traffic.” Expect further creativity in how we stream television as providers address the bandwidth issue.
According to Nielsen data, 35% of American TV households have broadband but do not use any subscription streaming services. The fact that 24.5% of people do not have a broadband connection complicates the streaming concept even more.
That is one of the reasons why Netflix’s DVD distribution business is still going strong. Customers in rural locations without high-speed internet use DVDs to view the movies and TV shows they want. For those subscribers, gaining access to streaming services will be difficult.
The Limits of the Streaming Model: Password Sharing
Another limitation of the video streaming strategy is password sharing. Password sharing for streaming services is frequent, especially since many services allow you to stream from many devices at the same time. Perhaps you could share (or borrow) a streaming password.
Netflix and HBO executives have dismissed fears that password sharing threatens the streaming firms’ economic model. Nonetheless, password sharing results in significant losses. According to Parks Associates’ research, “credential sharing” cost streaming providers over $500 million in revenue worldwide in 2015.
According to the poll, “6% of U.S. broadband households use an OTT video service that is paid by a person living outside of the household.” 11% of households have a joint account.
Younger Americans are more likely to share their passwords for video streaming services. According to Parks Associates study, “20% of OTT users aged 18-24 use an OTT video service paid for by someone outside the home, the highest of any age group.”
Further research into password sharing among Americans aged 18 to 24 discovered that “few respondents expressed guilt or embarrassment over using someone else’s video service credentials.” This could imply that, while password sharing isn’t a threat to streaming service revenue right now, it may become more of a problem as young Americans age and pass on their password sharing habits.
Bottomline
Will today’s elderly Americans (those most willing to pay and least likely to share passwords) be replaced by consumers unwilling to pay for their own subscription services? Time will tell. What appears certain is that streaming services will continue to explore for less bandwidth-intensive ways to provide material while also producing their own unique content.











Comments