
 By
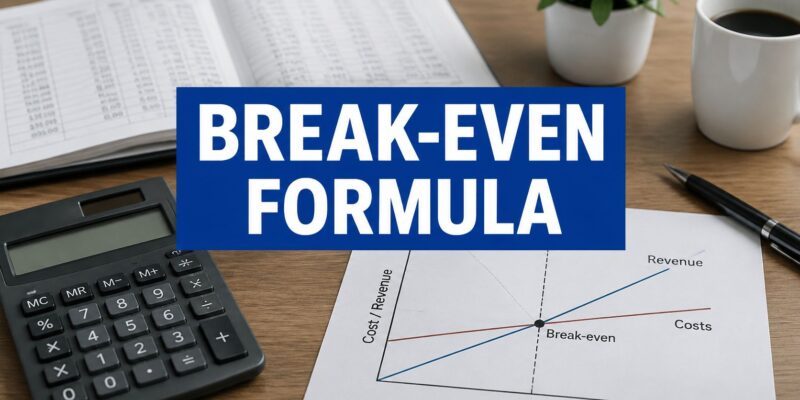
Break-even units equal total fixed costs divided by contribution margin per unit. Run that with $18,000 in monthly fixed costs and an $80 contribution margin per unit and you get 225 units, or $22,500 in sales, the point where operating profit is zero.
Most owners know last month's revenue. Fewer know how many sales it took to cover the month's costs, or how quickly that threshold changes when a supplier raises prices. The division takes a minute. Deciding whether to trust the answer takes longer, because the result depends on the price, cost split, and sales mix you put into it.
This walkthrough covers the arithmetic and shows how to check the assumptions behind it. We'll use one running example, then change its inputs so you can see what happens before applying the method to your own books.
Table of Contents
- Accounting Break-Even Formula at a Glance
- Classifying Costs Before You Calculate
- How to Calculate Break-Even Units Step by Step
- Break-Even Sales Dollars and How Price and Cost Changes Move Them
- Break-Even for Businesses With Several Products
- Using the Result to Set Profit Targets and Safety Margin
- Assumptions and Limits of the Break-Even Formula
- Related Metrics and Where Each Formula Fits
- Decide What to Do With Your Break-Even Number
Accounting Break-Even Formula at a Glance
How many units must a business sell before sales cover the costs of operating? That threshold is the accounting break-even point: total revenue equals total costs, and operating profit is exactly zero. Sales above the threshold generate operating profit if the assumed price and cost per unit hold; sales below it produce an operating loss.
The accounting break even formula is break-even units = total fixed costs ÷ contribution margin per unit. First calculate contribution margin per unit = selling price per unit – variable cost per unit. The OpenStax managerial accounting chapter also gives the revenue version: break-even sales dollars = total fixed costs ÷ contribution margin ratio, where the ratio is contribution margin per unit divided by selling price per unit.
Keep one example in view. A business has $18,000 in monthly fixed costs. It sells one unit for $100, with $20 in variable costs for that sale. Each unit contributes $80 toward fixed costs. Divide $18,000 by $80 and the business needs 225 units per month to break even. At $100 each, that's $22,500 in monthly sales.
The period matters. If the $18,000 represents monthly costs, 225 is a monthly target, not a weekly or annual one. Also, break-even here refers to operating profit under the costs included in the model. It does not mean the business has enough cash on hand to pay every bill when it falls due.
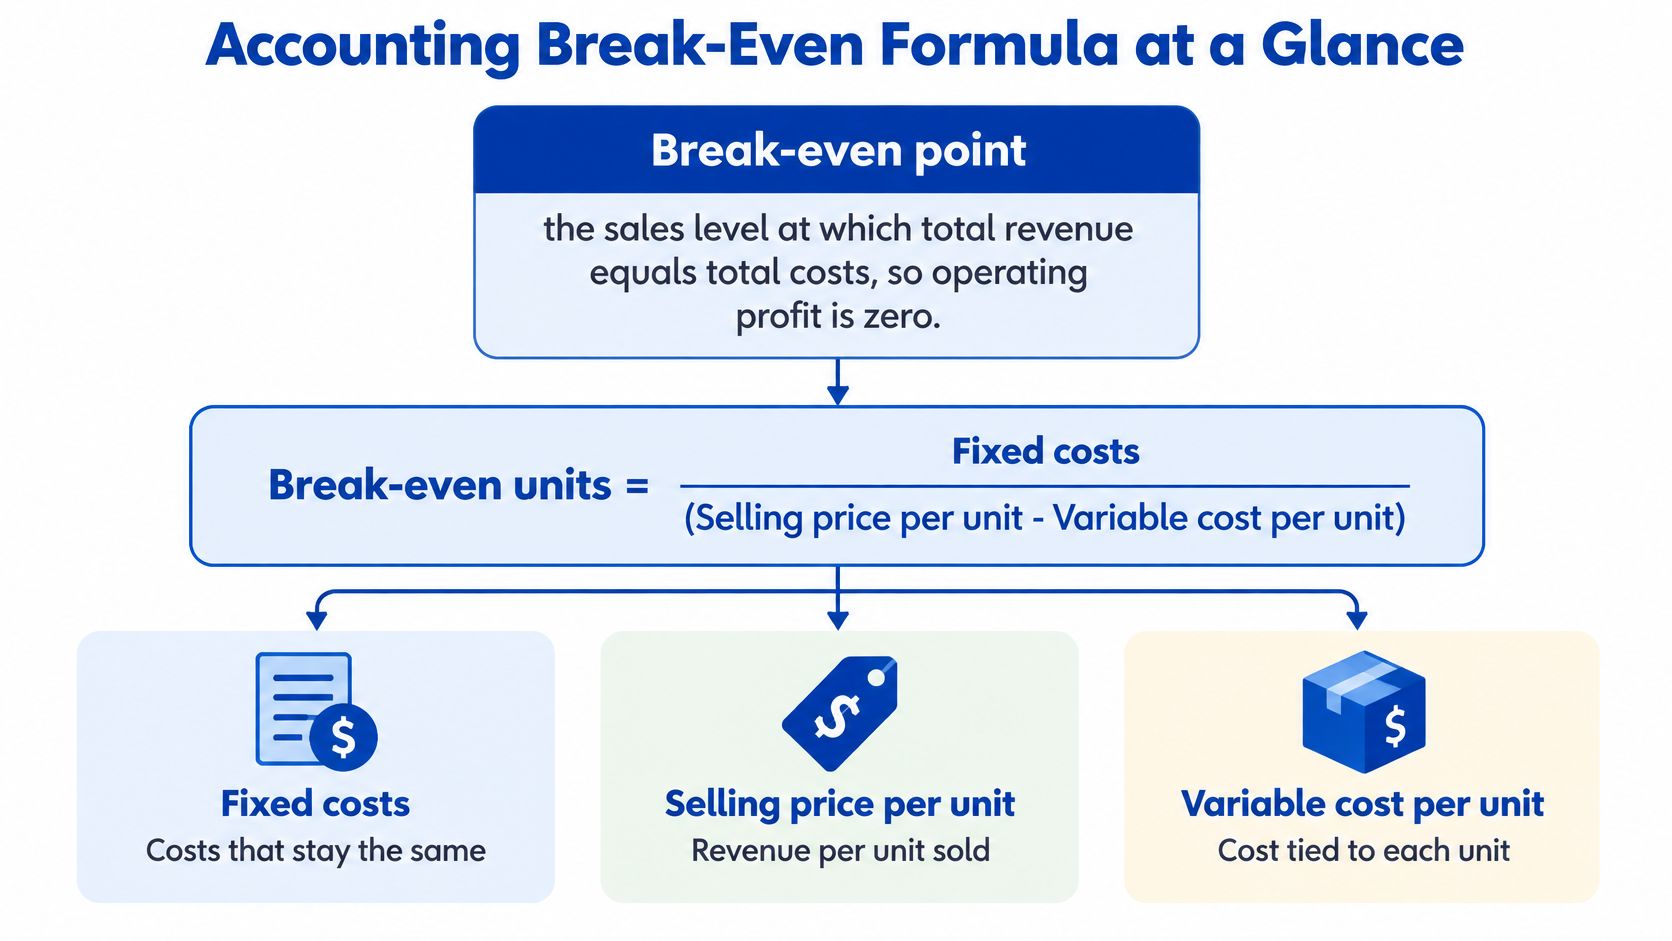
What each input means
| Variable | Meaning | Example value |
|---|---|---|
| Total fixed costs | Costs that stay the same across the volume being analyzed in the period | $18,000 per month |
| Selling price per unit | Amount the business actually receives for one unit before variable costs | $100 |
| Variable cost per unit | Cost that increases with each additional unit sold | $20 |
| Contribution margin per unit | Selling price minus variable cost per unit | $80 |
| Contribution margin ratio | Contribution margin per unit divided by selling price | 80% |
| Break-even units | Total fixed costs divided by contribution margin per unit | 225 units per month |
| Break-even sales dollars | Total fixed costs divided by contribution margin ratio | $22,500 per month |
Think of fixed costs as the monthly bill that must be covered even when sales are slow. The contribution margin is what each sale adds toward that bill after its own variable costs are paid. After the 225th unit covers the remaining fixed costs, another unit sold at the same price and variable cost adds $80 to operating profit, assuming there is no new step cost.
For instance, at 200 units, contribution margin totals $16,000, leaving a $2,000 operating loss against $18,000 in fixed costs. At 250 units, contribution totals $20,000, yielding $2,000 in operating profit. This is why contribution margin, rather than selling price alone, belongs in the denominator.
Now test the inputs. If variable cost is $40 instead of $20, contribution margin falls to $60 and break-even climbs to 300 units. If fixed costs rise to $24,000 while margin stays at $80, break-even also reaches 300 units. Cutting price to $80, with the original $20 variable cost, has the same unit effect. The equal results come from different business problems, so each calls for a different response.
Start with one month of records: total the relevant fixed costs, choose a product, verify the price actually collected and the variable cost incurred, then run the division. Treat the result as a planning threshold, not a forecast of what customers will buy.
Classifying Costs Before You Calculate
Break-even is only as useful as the cost split behind it. The goal is to ask how each cost behaves within the sales range and time period you're planning for. A cost can look fixed this month and change next quarter when the business outgrows its current capacity.
| Cost type | Behavior | Examples | Treatment in formula |
|---|---|---|---|
| Fixed | Same total within the relevant volume range for the period | Rent, insurance, salaried staff, software subscriptions | Include the full period amount in fixed costs |
| Variable | Changes with each unit sold or fulfilled | Materials, packaging, per-order shipping, transaction fees, commissions | Include the per-unit amount in variable cost |
| Semi-variable (mixed) | Has a standing base and a usage-based component | Utilities, phone plans with usage charges, equipment maintenance | Split the base from the usage-driven amount |
| Step-fixed | Stays flat within a capacity range, then jumps | Extra shift supervisor, added warehouse space, another production line | Calculate separately before and after the step |
A bakery makes the categories tangible. The oven lease and liability insurance are usually fixed for the month. Flour and cake boxes vary with the number of cakes made and sold. The gas bill may include a standing charge plus usage that rises as ovens run. A second supervisor could be unnecessary up to a certain production volume, then unavoidable beyond it.
Suppose the bakery pays $300 a month as a utility base charge plus roughly $0.50 per cake in usage. For a simple model, the $300 joins fixed costs and $0.50 joins variable cost per cake. If you put the whole utility bill into fixed costs using a busy month's invoice, you'll overstate the fixed burden in slow months and understate the cost of each additional cake.
Take similar care with costs whose labels are misleading. A software subscription can be fixed if its monthly fee stays unchanged, but a per-transaction software fee is variable. A salesperson's base salary can be fixed while their per-sale commission is variable. Loan interest may be included if the operating measure you're modeling includes that financing expense; loan principal is a cash outflow, not an income-statement expense. Be explicit about which costs and profit measure your calculation covers.
Review invoices, payroll and sales records across several periods. Ask which costs appeared when sales were low, which climbed with orders, and whether hiring or capacity changes caused sudden jumps. If a cost doesn't split neatly, document your estimate and rerun the calculation with a reasonable higher and lower value.
Rule of thumb: if one more sale directly increases the cost, treat that increment as variable. If you owe the same amount with no sales, treat it as fixed within the period and range you're analyzing.
If sorting monthly bills into these buckets feels like guesswork, this guide to understanding your business overhead walks through the fixed side in more detail.
How to Calculate Break-Even Units Step by Step
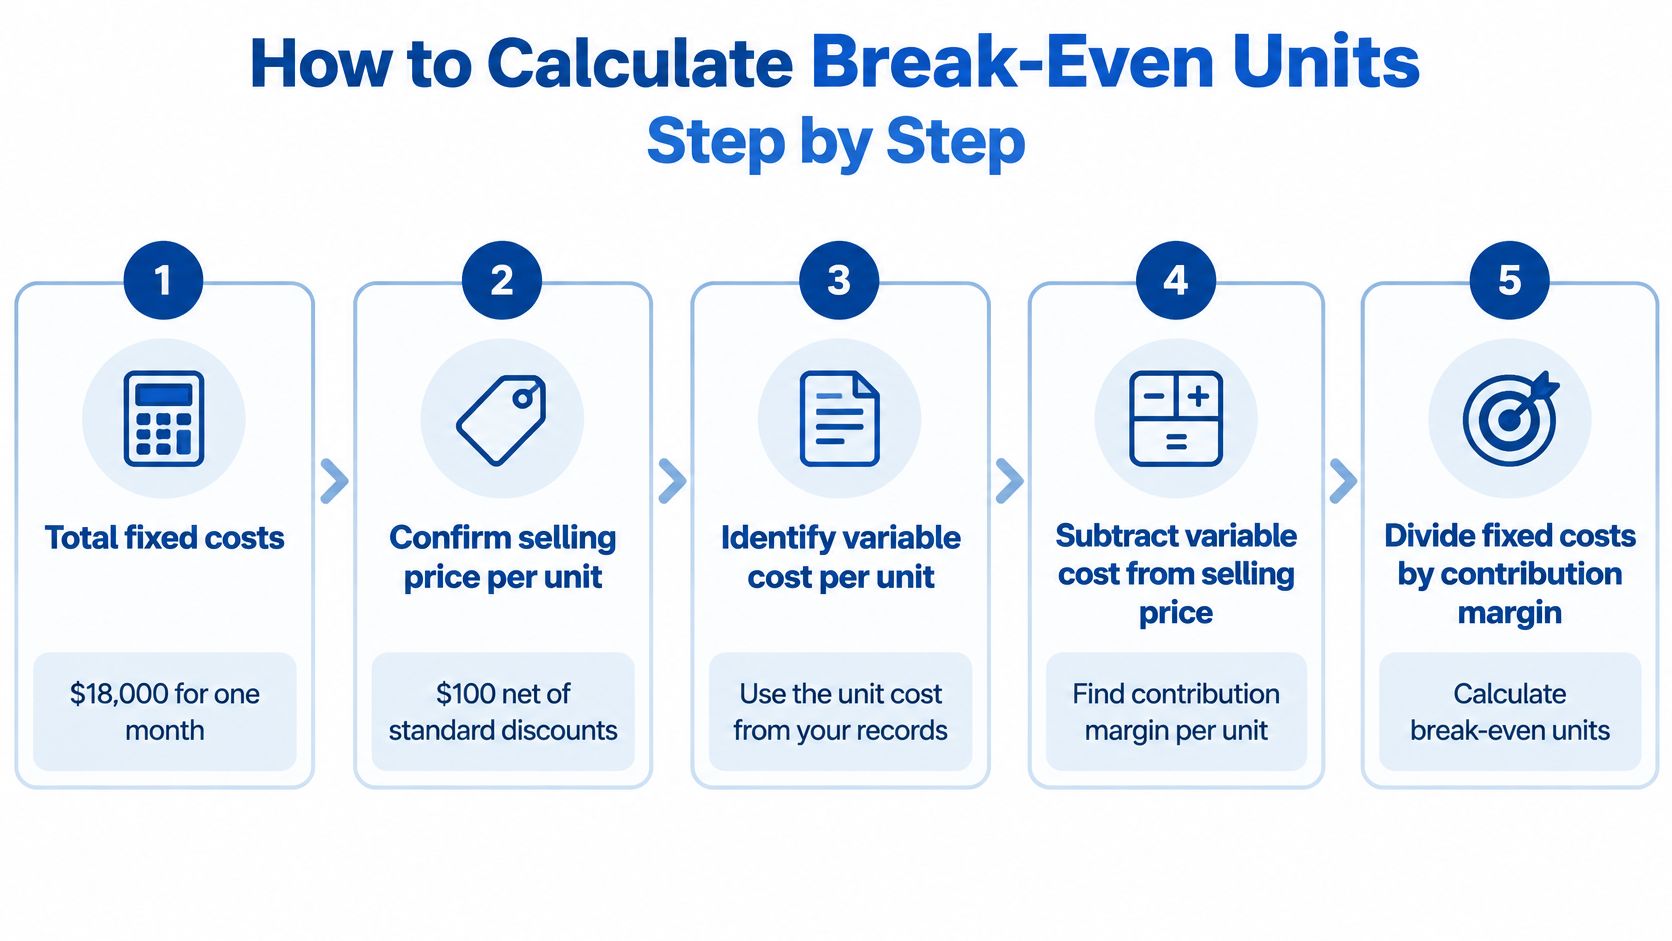
Use the same period throughout. The following seven steps take the running example from raw inputs to a checked result.
Total fixed costs for one period. Use $18,000 per month. Include costs that apply to the operation being modeled and keep an itemized list so you can update it when rent or staffing changes.
Confirm the actual selling price per unit. Use $100 if that is the price normally collected. If a $100 list price is regularly reduced by discounts, work from the effective selling price instead. A discount lowers contribution margin even when the product itself costs no more to make.
Total variable cost per unit. Use $20, covering relevant materials, packaging, fees and fulfillment. If shipping is charged to customers separately, account for both the shipping revenue and its associated cost consistently rather than silently counting only one side.
Calculate contribution margin per unit. $100 – $20 = $80. This is the amount each unit contributes toward fixed costs and, after those costs are covered, operating profit.
Divide fixed costs by contribution margin. $18,000 ÷ $80 = 225 units per month. The units in the answer come from dividing dollars per month by dollars per unit.
Round up if necessary. If the quotient is 225.1, plan for 226 complete units. Rounding down would leave some fixed costs uncovered. The running example divides evenly, so no rounding is needed.
Verify with an income check. Revenue is 225 × $100 = $22,500. Variable costs are 225 × $20 = $4,500. Deduct $4,500 and $18,000 in fixed costs from $22,500, and operating profit equals $0.
You can repeat the check at a nearby volume. At 226 units, revenue is $22,600, variable costs are $4,520 and fixed costs remain $18,000. Operating profit is $80, exactly one additional unit's contribution margin. That check can catch a mistaken denominator or an omitted per-unit cost.
Copy-and-save break-even worksheet
Copy the CSV below into a plain-text file named break-even-worksheet.csv. To use it in Google Sheets, open a blank spreadsheet, select File > Import > Upload, choose the CSV file, and import it into a new sheet. Select Comma as the separator if Sheets asks. Check that the formulas appear in column B rather than as plain text; if they do not, repeat the import and disable any option that converts text to values.
Edit only cells B2 through B8: enter fixed costs, selling price, variable cost, forecast units, desired pretax operating profit, desired after-tax profit, and an assumed tax rate. For example, enter 0.25 in B8 for a 25% tax rate; you can then format B8 as a percentage. Use the same period for fixed costs, forecast units and both profit targets. The formula rows update automatically. Read B11 for break-even units, B12 for break-even sales dollars, B16 for pretax target units, and B20 for after-tax target units. You can also open the saved CSV in Excel.
Item,Value,Notes
Fixed costs per period,18000,Enter the total for one period
Selling price per unit,100,Use the price actually collected
Variable cost per unit,20,Include costs incurred per sale
Forecast units,300,Enter expected units sold in the same period
Target pretax operating profit,6000,Enter the pretax operating profit desired
Target after-tax profit,6000,Enter the after-tax profit desired
Assumed tax rate,0.25,Enter a decimal from 0 up to but not including 1
Contribution margin per unit,=B3-B4,Price less variable cost
Contribution margin ratio,"=IF(B3>0,B9/B3,"")",Format as a percentage
Break-even units,"=IF(B9>0,ROUNDUP(B2/B9,0),"No break-even at this margin")",Round up to whole units
Break-even sales dollars,"=IF(B10>0,B2/B10,"")",Revenue threshold using the contribution margin ratio
Forecast operating profit,=B5*B9-B2,Before taxes and costs not included above
Margin of safety units,"=IF(ISNUMBER(B11),B5-B11,"")",Negative means forecast units are below break-even
Margin of safety percent,"=IF(AND(B5>0,ISNUMBER(B11)),(B5-B11)/B5,"")",Format as a percentage
Pretax target units,"=IF(B9>0,ROUNDUP((B2+B6)/B9,0),"No target at this margin")",Round up to whole units
Pretax target sales dollars,"=IF(ISNUMBER(B16),B16*B3,"")",Sales at the rounded pretax target unit count
Additional units for pretax target,"=IF(ISNUMBER(B16),MAX(0,B16-B5),"")",Whole units needed beyond forecast
Pretax profit needed for after-tax target,"=IF(AND(ISNUMBER(B8),B8>=0,B8<1,ISNUMBER(B7),B7>=0),B7/(1-B8),"Check tax rate and target")",Simplified conversion from after-tax to pretax profit
After-tax target units,"=IF(AND(B9>0,ISNUMBER(B19)),ROUNDUP((B2+B19)/B9,0),"Check margin or tax inputs")",Round up to whole units
After-tax target sales dollars,"=IF(ISNUMBER(B20),B20*B3,"")",Sales at the rounded after-tax target unit count
Additional units for after-tax target,"=IF(ISNUMBER(B20),MAX(0,B20-B5),"")",Whole units needed beyond forecast
With the sample inputs, the worksheet returns 225 break-even units, $22,500 in break-even sales, $6,000 in forecast operating profit and a 25% margin of safety at 300 forecast units. The pretax target requires 300 units and $30,000 in sales, with 0 additional units needed beyond the forecast. For a $6,000 after-tax target at the assumed 25% tax rate, the worksheet converts the goal to $8,000 pretax, then returns 325 units, $32,500 in sales and 25 additional units beyond the 300-unit forecast. Change B7 or B8 to test another after-tax goal or tax assumption. The conversion is a simplified planning estimate, not a tax calculation; it assumes the stated tax rate applies to the modeled profit and that other taxes and costs have been accounted for consistently. Save a fresh copy before testing scenarios. This is a copy-and-save template, not a hosted download.
The slip that undoes the whole calculation
A common error is mixing time periods. If fixed costs are $18,000 per month, the result is 225 units per month. Comparing that number with a forecast of 225 units per week makes the same quantity look like the target, even though the weekly forecast implies far more monthly sales. Conversely, dividing annual fixed costs by a monthly contribution figure without converting the period can make the target look implausibly high.
The price and cost inputs also need to describe the same unit. Don't use a case-level selling price with a single-item variable cost, or an average invoice value that includes several products with the cost of just one product. Write the unit and the period beside every input: $18,000/month, $100/unit and $20/unit. Then label the answer 225 units/month.
Finally, check that the contribution margin is positive. If variable cost equals or exceeds the selling price, selling more of that unit cannot cover fixed costs under the current assumptions. Changing the price, cost structure or product mix comes before dividing.
Break-Even Sales Dollars and How Price and Cost Changes Move Them
If your reports emphasize revenue rather than units, calculate a dollar threshold. The contribution margin ratio tells you how much of each sales dollar remains after variable costs. In the running example, $80 ÷ $100 = 0.80, or 80%. In other words, each $1 of sales contributes $0.80 toward fixed costs and operating profit under these assumptions.
Divide fixed costs by the ratio: $18,000 ÷ 0.80 = $22,500 in monthly sales. To check it, 80% of $22,500 is $18,000, just enough to cover monthly fixed costs. For a single product, this matches 225 units × $100. For a changing product mix, a dollar threshold only works reliably if its blended contribution margin ratio reflects the actual mix.
To understand which assumptions matter, change one input at a time. This table holds the other inputs at their base-case values and rounds fractional break-even units up to whole units.
| Scenario | Selling price | Variable cost | Fixed costs | Contribution margin per unit | Break-even units |
|---|---|---|---|---|---|
| Base case | $100 | $20 | $18,000 | $80 | 225 |
| Lower price | $80 | $20 | $18,000 | $60 | 300 |
| Higher price | $120 | $20 | $18,000 | $100 | 180 |
| Price rises to $110 | $110 | $20 | $18,000 | $90 | 200 |
| Higher variable cost | $100 | $60 | $18,000 | $40 | 450 |
| Lower variable cost | $100 | $15 | $18,000 | $85 | 212 |
| Fixed costs rise to $21,000 | $100 | $20 | $21,000 | $80 | 263 |
| Fixed costs fall to $15,000 | $100 | $20 | $15,000 | $80 | 188 |
The last two rounded results come from 262.5 and 187.5 units respectively. The lower-fixed-cost row uses $15,000 in the calculation, not the $18,000 base-case amount.
Reading the table like an owner
A price cut from $100 to $80 raises break-even from 225 to 300 units, a 33.3% increase in unit volume just to return to zero operating profit. The new dollar threshold is 300 × $80 = $24,000. The discount could still make sense if it generates enough additional demand, but you need a volume forecast to test that claim.
A price rise to $120 lowers the threshold to 180 units, or $21,600 in sales. That doesn't prove the higher price is better: some customers may leave or buy less. Compare the projected sales volume at each price with its new break-even threshold, rather than assuming today's volume survives a price change.
The $60 variable-cost scenario doubles required unit volume to 450 units, with $45,000 in sales at the unchanged $100 price. This deliberately large change illustrates the direction and scale of the risk. For routine planning, also test smaller changes, such as your actual supplier quote or a few dollars more in shipping per order.
Fixed-cost changes may be easier to translate into a monthly sales target. An additional $3,000 in monthly fixed costs requires $3,000 ÷ $80 = 37.5 more units of contribution margin. Since half a unit can't be sold in this example, the threshold moves from 225 to 263 units. If fixed costs fall to $15,000, the calculation gives 187.5, so the practical threshold is 188 units.
Use the scenario that resembles a decision you can actually make. A price test needs a demand estimate; a supplier negotiation needs a defensible per-unit cost; and a new hire needs a calculation that includes the salary plus any extra capacity or sales it enables.
Break-Even for Businesses With Several Products
One product's contribution margin rarely describes an entire catalog. If low-margin items take a larger share of sales than expected, a break-even calculation based on the premium product can underestimate the sales required. A practical solution is a composite unit, a bundle representing the sales mix you expect to maintain.
First calculate contribution margin for each product. Then set a bundle containing the products in their expected proportions. Composite-unit contribution margin = sum of each product's contribution margin multiplied by its quantity in the bundle. Divide fixed costs by the bundle margin to get break-even bundles.
Suppose a Basic plan contributes $12.00 per sale and a Pro plan contributes $18.75. With one of each in a representative bundle, the margin per bundle is $30.75. At $145,000 in fixed costs for the same period, $145,000 ÷ $30.75 = 4,715.45 bundles. Round up to 4,716 bundles, meaning 4,716 Basic and 4,716 Pro sales, or 9,432 individual sales. At that level, the $30.75 contributed by each full bundle covers fixed costs.
The mix must be plausible. If past sales instead show two Basic plans for every Pro plan, a bundle contains two Basics and one Pro. Its contribution margin becomes (2 × $12.00) + $18.75 = $42.75 across three sales. Break-even is $145,000 ÷ $42.75 = 3,391.81 bundles, rounded up to 3,392 bundles, or 10,176 individual sales: 6,784 Basic and 3,392 Pro. There are fewer bundles than in the one-to-one case, but each bundle contains more products. The meaningful comparison is 10,176 sales versus 9,432 sales, not the bundle counts alone.
Build a usable multi-product model in four passes:
- Calculate a complete margin for each product. Include the variable costs tied to each sale, such as processing, commissions and fulfillment. Don't stop at price minus materials.
- Estimate the mix from evidence. Use recent sales counts where possible and note whether promotions, seasons or new products could change the proportions.
- Calculate break-even bundles and convert them back to products. Rounding the bundle count up keeps the assumed proportions intact. A real business need not sell literal bundles; they are a planning device.
- Stress-test the mix. Increase the proportion of the lower-margin product and compare the resulting individual sales target with the capacity and demand you expect.
For sales-dollar break-even across several products, you can instead calculate a blended contribution margin ratio from expected sales revenue and expected variable costs. That ratio, like the composite bundle, depends on the assumed mix. Update it when the mix changes materially.
Using the Result to Set Profit Targets and Safety Margin
Break-even gives you a floor, not the revenue needed to reward the owner, build reserves or absorb a slow month. A 2024 small business statistics compilation from Cin7 reports that 30% of small businesses break even, while 40% eventually become profitable and 30% lose money. For your own plan, the more useful question is how far above break-even you need to operate.
The running example makes that distinction clear. At 225 units, operating profit is $0. At 250 units, the extra 25 units contribute 25 × $80 = $2,000 in operating profit if prices, variable costs and fixed costs remain unchanged. A target can be expressed either as a profit amount or as a buffer above the threshold.

From break-even to a profit target
For a target stated as pretax operating profit, add the target to fixed costs before dividing: target units = (fixed costs + desired operating profit) ÷ contribution margin per unit. To earn $6,000 a month on the running assumptions, calculate ($18,000 + $6,000) ÷ $80 = 300 units. Check: 300 × $80 = $24,000 in total contribution; after $18,000 in fixed costs, $6,000 remains.
If your goal is after-tax profit, convert that goal to a pretax amount before using a simplified model. At an assumed 25% tax rate, $6,000 after tax requires $6,000 ÷ (1 – 0.25) = $8,000 before tax. Then ($18,000 + $8,000) ÷ $80 = 325 units. This illustration assumes the tax rate applies as modeled and that the costs and profit measure in your calculation are consistent. Actual tax outcomes and owner compensation can require a more detailed plan.
The same method can test a planned expense. If a new recurring cost adds $800 a month and does not change price or variable cost, it requires $800 ÷ $80 = 10 extra units a month just to preserve the previous profit level. If it helps you sell more than 10 additional units, the added contribution can exceed its modeled cost.
Margin of safety in plain numbers
Margin of safety = forecast sales – break-even sales. As a percentage, divide that difference by forecast sales. Forecast 300 units against a 225-unit break-even point and the cushion is 75 units. Its percentage is 75 ÷ 300 = 25%. With constant price and mix, the equivalent dollar cushion is $30,000 – $22,500 = $7,500.
That percentage means forecast unit sales could fall by 25% before reaching the modeled break-even point. It does not mean every unexpected expense is covered, or that a 25% fall in revenue is harmless if discounts or product mix also change. At 240 units, for example, the cushion shrinks to 15 units, or 6.25% of forecast units. A small forecast error would then make a meaningful difference.
There is no universal cushion that makes every business safe. Compare your margin of safety with the swings in your own past sales, customer concentration and the time needed to reduce costs. A seasonal business may need to model strong and weak months separately rather than rely on one annual average.
Worth pinning up: the break-even figure is the floor, not the plan. Margin of safety shows how much of your forecast sits above that floor.
Set a target that supports your desired profit and a cushion you can defend. For levers that push revenue further above the floor, these tips to increase your business profit cover pricing and cost work in more depth.
Assumptions and Limits of the Break-Even Formula
A break-even figure is a model of a particular period and operating range, not a guarantee. Its simplest form assumes that selling price, variable cost per unit and sales mix hold steady, and that fixed costs stay fixed over the volume analyzed. Those assumptions make the calculation useful, but they also mark where it can fail.
A promotion is an easy example. If a $100 product is discounted to $90 while variable cost remains $20, contribution margin falls from $80 to $70. With fixed costs still at $18,000, break-even becomes $18,000 ÷ $70 = 257.14, or 258 units. The old 225-unit target no longer covers the same costs.

Variable cost can shift too. A supplier increase, rush shipping or overtime can reduce contribution on the next unit even when the list price is unchanged. Fixed costs can jump at a capacity limit: if an extra supervisor is required after a certain sales volume, a model that assumes the original fixed cost at all volumes understates the threshold beyond that point.
Patch the largest gaps with a more specific scenario:
- Variable selling prices: use the price actually collected for the relevant sales or model discounted and full-price sales separately.
- Changing variable costs: calculate with realistic cost tiers if supplier prices, overtime or shipping charges change at different volumes.
- Step costs and capacity: identify the volume at which an added shift, machine or space is needed, then recalculate with the higher fixed cost.
- Changing product mix: use a composite bundle or a blended contribution margin ratio tied to a documented mix.
- Unsold inventory: compare the threshold with units sold and recognize that costs and profit can be reported differently when inventory builds. A unit produced but not sold does not generate sales revenue.
- Cash timing: prepare a separate cash-flow forecast. A month can meet an accounting target yet still face a shortfall if customers pay after suppliers and staff must be paid.
- Debt repayments: account for financing costs consistently in the profit measure you choose, and check principal payments separately in cash planning. Paying back principal is not an operating expense in this formula.
For example, if your model says 225 units but the next 50 units require an additional fixed-cost commitment, calculate the economics on both sides of that capacity step. Don't assume the first unit above 225 automatically earns $80 if it triggers a substantial new expense.
A break-even number is a statement about your assumptions, not a promise about your future.
Related Metrics and Where Each Formula Fits
Break-even answers a specific question. Nearby measures help you turn the answer into a decision. Keep their units and assumptions consistent so that a unit-based target, a sales-dollar target and a profit forecast describe the same plan.
| Question | Formula or measure | Covered in section |
|---|---|---|
| How many units cover fixed costs? | Total fixed costs ÷ Contribution margin per unit | Accounting Break-Even Formula at a Glance |
| What revenue covers fixed costs? | Total fixed costs ÷ Contribution margin ratio | Break-Even Sales Dollars and How Price and Cost Changes Move Them |
| What share of each sale covers fixed costs? | Contribution margin ratio = Contribution margin per unit ÷ Selling price per unit | Break-Even Sales Dollars and How Price and Cost Changes Move Them |
| How many units for a target profit? | (Total fixed costs + Desired pretax operating profit) ÷ Contribution margin per unit | Using the Result to Set Profit Targets and Safety Margin |
| How far can sales fall before losses? | (Forecast sales – Break-even sales) ÷ Forecast sales | Using the Result to Set Profit Targets and Safety Margin |
| Which input moves break-even most? | Recalculate break-even for each single change | Break-Even Sales Dollars and How Price and Cost Changes Move Them |
The measures interlock. In the running example, an 80% contribution margin ratio turns $22,500 in sales into $18,000 of contribution. A forecast of $30,000 in sales creates a $7,500 dollar margin of safety. At the original price and cost, that forecast also equals 300 units, which yields $6,000 in operating profit. Three views of the same model should reconcile.
Cost-volume-profit analysis extends this logic across pricing, volume and cost scenarios. Instead of asking only where profit reaches zero, you might compare a $100 price at 300 expected sales with a $110 price at a lower expected volume. Each scenario needs its own contribution margin and volume assumption.
Operating sensitivity, often described using the degree of operating leverage, can be calculated at a given positive operating profit as total contribution margin ÷ operating income. At 300 units in the example, contribution margin is $24,000 and operating income is $6,000, producing a ratio of 4. Under unchanged costs and within the relevant range, that indicates operating income responds proportionally more strongly than sales volume. At break-even, operating income is zero, so this ratio is not defined there.
Use break-even to find the floor, target-profit units to set a goal, margin of safety to examine the cushion, and scenario analysis to see which assumptions could change the answer.
Decide What to Do With Your Break-Even Number
Put a forecast for the same period beside your break-even figure in units and dollars. The difference tells you whether the current plan covers its modeled costs and how much room you have if sales disappoint. Then work through four moves.
- If forecast sales fall below break-even, identify the gap. A forecast of 200 units against a 225-unit threshold leaves a 25-unit shortfall and a modeled $2,000 operating loss. Decide whether a price change, lower variable cost, lower fixed costs or credible additional sales could close it.
- Change one assumption at a time. If variable cost is uncertain, recalculate with a higher supplier quote. If you're considering a discount, use the discounted price and estimate the additional units it would need to sell. Keep the original scenario beside each alternative.
- If forecast sales exceed break-even, check the cushion and target profit. At 240 expected units, you're above the floor by 15 units, but only by 6.25% of forecast volume. At 300 units, the cushion is 75 units and the modeled operating profit is $6,000.
- Update the model when its inputs change. A lease renewal, new hire, supplier increase, price promotion or meaningful mix shift can move the threshold. Note the date and assumptions beside every version so an old figure isn't mistaken for today's target.
Before acting, test the input you trust least. If rent is fixed under a signed lease but per-unit fulfillment cost is estimated, recalculate break-even at both a higher and lower fulfillment cost. A small change in the threshold suggests that estimate may be good enough for the current decision. A large change tells you which invoices to check before committing to a target. The same discipline applies when weighing a new expense against its expected return, which is what a cost-benefit analysis is built to test.
Mega Income Stream's finance and business-operations coverage includes cost management and revenue planning. If you'd like to work through more of these ideas before building your own model, browse the finance and business guides at Mega Income Stream. Start with one month's fixed costs and one product's verified contribution margin, then label the threshold with the period it covers.










Comments