The sales pipeline is essential for managers and sales leaders to comprehend what is occurring across the entire sales process. Depending on your business strategy, it provides you with the ability to follow your customer’s journey from qualified prospect to paying customer and beyond.
Therefore, the most important thing to comprehend when examining your sales funnel is the exact reason a prospect is moving forward or not. In order to create that image, you must determine the contributing elements and factors—whether positive or negative—that are influencing that prospect’s path and how to get past them.
Finding potential and existing problems in your pipeline is one of the main benefits of pipeline analysis. By using past data, you may identify the stages of a sales process that frequently result in deal collapses and take preventative measures to ensure that they don’t happen again. Furthermore, as your comprehension and analytical abilities grow, you’ll be able to overcome obstacles as they arise, raising your odds of success and increasing the precision of your forecast.
As previously indicated, having the ability to analyze your pipeline allows you to more precisely predict when it will close by accounting for obstacles and the performance of your sales force. By accurately assessing your pipeline and detecting the problems with your sales process, you can also look back on previous results to enhance your procedures and increase the effectiveness of your sales representative coaching.
To make sure you continuously hit your goals, this guide will assist you in precisely analyzing your sales funnel.
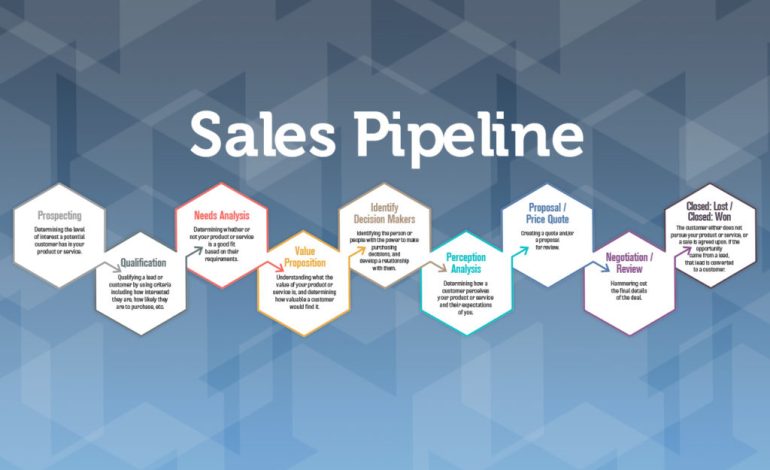
Understanding the different stages of deals
Deal stages help you to track the progression of a sales process and provide a guide for understanding where the prospect is concerning your ultimate goal, purchase. For example, if you had 500 people in a sales process, they would not all at the same point in the decision-making process. By placing them in different stages you can understand their likelihood to buy, and what thought processes are likely and ultimately help direct your sales reps to make the right courses of action to close the deal.
Putting each potential customer into relevant deal stages effectively creates a programmatic action plan aligned to how close the prospect is to buying and quickly outlines what the next steps of the process should be (i.e. you don’t just send out an order form before you’ve qualified how you can help someone).
Great so you just start to build your deal stages from a template, easy right? Unfortunately, the stages that are required are different for every business. The process needs to be suited to your own business and practices, just picking out a templated formula will create more problems than it will solve.
So how do you start to create the stages for your business? Look at your sales process and review its flow. Identify where the contact points are, what kind of buy-in is needed and what is the pacing for your process, this will give you the blocks to start to create your own.
Take a B2B SaaS business, for example, their deal stages might run something like this:
- Prospecting
- Stakeholder Buy-In
- Demo
- Trial
- Proposal
- Negotiation
- Closed Won
- Closed Lost
The list can seem like it is endless, but it is important to be concise; you need to make sure that each stage within your flow is required. Your deal flow will be unique to your specific process, but avoid adding contact or action points that aren’t an integral part of how you engage with your customers. Each stage of your flow should be an indicator of intent for the prospect, highlight how qualified they are as a sales lead and continuously push them to the ultimate goal.
Understanding the important sales metrics to track
Having established how your prospects will move through your pipeline and how you can qualify that movement, it is time to look at how you can track and quantify that progress with metrics. Sales metrics are fundamental to understanding how your opportunities are contributing to the success of the business. By setting targeted metrics gives you a better understanding of your current situation and allows you to analyze your progress; which makes planning and forecasting much easier.
Read Also: How do You Track the Sales Pipeline?
We are sure that you have seen hundreds of different sales metrics and statistics that you can track to understand your current positioning. But what is important? Below are the top metrics that we believe you should be tracking:
- Win Rate
One of the most important metrics to track is your win rate. Win rate is defined as the percentage of final-stage deals that close and become customers. This is your best indicator of the performance of your sales strategy; if the win rate is low then deals aren’t closing then it is a good signal that your sales process isn’t working.
You need to be consistent with your definition of what a win or loss means, some companies complicate their understanding by including a “No Decision” option wherein a prospect chooses not to purchase but also doesn’t purchase from any competitors either. You need to ensure that you choose how you define a win, a loss, and if there are any other factors from the outset, otherwise you make it extremely difficult to analyze and find issues within your sales operation.
- Sales Cycle Length
Knowledge of how long a prospect is part of your sales process and the length of time they stay in each deal stage is key to your sales forecasting. Taking an average of that length of time from making first contact through to winning and closing the deal, can give you great insight into how many deals you are likely to close in any set period. Not only that but you can more confidently predict what your sales figures might look like over time.
- Average Deal Value
Average Deal Size is the average of the revenue generated by deals that have been won over a specific period. While taking a general overview gives you a holistic insight into how much business is being generated, giving a gauge to how likely you are to reach your quota.
Average Deal Values can be also segmented over net new, existing or returning business to give a more granular view of how different areas of your pipeline are contributing to your overall target. By having insight into your average values you can also optimize your sales pipeline velocity by highlighting where your most profitable deals are coming from enabling you to develop new strategies or propositions.
- Number of Opportunities
This seems like an obvious one but we find businesses all too often don’t keep track of this metric. The number of deals your teams are working on is critical for understanding your entire potential pipeline, if you don’t know how many opportunities are within your pipeline you will lack insight into other key metrics. Furthermore, knowing the number of opportunities within your pipeline enables effective focusing of your sales teams and an understanding of how many deals your teams can process within a given time frame.
- Sale Pipeline Velocity
The reason it is so important to track all of the above metrics is their sum total, when you take each of these elements separately you do get a good understanding of how certain parts of your pipeline are performing but added together you get sales pipeline velocity. SPV is basically how quickly your pipeline is driving revenue.
It provides insight into how fast your deals are moving through your pipeline (Sales Cycle Length), how much each of your deals is contributing (Average Deal Value), how many deals you have and how many you need to achieve your quota (number of opportunities) and how effectively you are closing deals (win rate). It creates a master metric that analyzes your pipeline and gives you actionable insights all-in-one.
By understanding how your sales pipeline velocity is performing you are quickly able to see the health of the business and see where and how it is growing. By measuring this you can more effectively optimize your sales processes and coach your reps to be more efficient sellers.
Sales velocity is key to understanding from a holistic perspective what is happening with your pipeline and the business as a whole. But it is holistic, the previous metrics give you the granular details needed to review specific roadblocks or opportunities that help you to analyze your pipeline and grow more effectively.
- Deal Drop-off by Stage
As much as you need to know what is going right, you also need to know what is going wrong. Deal drop-off is where you have been unsuccessful in your pitch, while this can be a loss of opportunity and effort it isn’t a total loss. One of the best ways to improve is to understand why the failure happened. By analyzing what happened to the unsuccessful deals you can see what parts of your pipeline or process aren’t converting, and by segmenting it by stages you can quickly and effectively identify what is causing customers to turn off.
More importantly, by segmenting this analysis by the deal stage the prospect was in you can more effectively see where there are faults in your sales pipeline and prioritize your investigation based on their stage (Read: prospects that drop off at final stages are the most important).
- Conversion Rates Through Stages
Much like the deal drop-off, your stage conversion rate gives you insight into the health of your sales process and highlights where action needs to be taken to improve your pipeline. By analyzing the number of opportunities that move from one stage to the next, you can gain insight into problems such as: where a particular sales rep needs more coaching, if the product proposition needs more work or refinement, or if your sales process needs fixing.
Conducting a proper analysis of your stage conversion rates can give some interesting results, and not just the obvious. By where the conversion percentage is extremely high (90%+) can show where your stages are perhaps too complicated and can be simplified.
- Relationships Connected to Accounts
One of the key aspects that you need to know about is how best to drive the deal forward and what assets can be used to achieve that. Each of your prospect accounts will have multiple sales reps attached to it in different ways and leveraging those relationships can be key to landing the deal and not.
By understanding how your reps are connected with your target account and how those relationships can be used to improve the likelihood of a close-won result gives you a keen edge over competitors. By utilizing the relationships your team can more effectively communicate your proposition to key decision-makers and can dramatically decrease sales cycle lengths.
- Engagement Levels
By tracking your prospect engagement levels, you can understand the likelihood of a close won situation and estimate when the close will happen. Making forecasting your pipeline so much easier. It also allows you to more effectively target your sales team’s efforts by knowing what deals are potentially at risk due to disengagement by the customer or rep.
According to our data, by identifying deals at risk by disengagement within the first two weeks you are 85% more likely to recover a potentially lost deal. Furthermore, by recognizing where the breakdown in engagement is happening you can improve your sales rep coaching sessions with targeted insights.
Setting a Strong Foundation, Sets a Stronger Future
By understanding what is needed to build a strong pipeline and sales process from the start makes it easier to analyze your current performance. While it isn’t always possible to set these elements up from the start they are relatively easy to retroactively integrate into your processes. By breaking down and segmenting your pipeline analysis, you gain greater insight and granular detail on what is hindering your sales teams and stopping you from achieving your quotas.
Prior to creating a pipeline analysis, data must be gathered. This information can be gathered in a number of ways, such as by asking your sales representatives, surveying your consumers, or reviewing past performance. Make sure the data you have is correct and current. After you have it, arrange it in an approachable format.
Moreover, you might have to use a pipeline analysis tool. Of course, you may use spreadsheets to manually analyze your sales data, but it will take a lot of time and work. Not to add, you could overlook important information or perform computations incorrectly. Your life can be simplified by utilizing Revenue Grid, an artificial intelligence-powered pipeline analysis tool.