
 By

Profitability is the profit a business retains after covering its costs, measured through profit margins and returns on invested capital. A sound business profitability strategy tracks those measures alongside cash flow, customer experience, and the costs of serving each market. Expanding can create new revenue, but only when the underlying economics support it.
More sales do not automatically mean more profit. Pricing, operating expenses, customer retention, and delivery costs all affect what a business keeps. A new channel or market also brings investment and operational demands.
This guide explains how to calculate gross, operating, and net profit margins, assess costs without weakening the customer experience, and evaluate investment returns. It also shows how unit economics and cost-to-serve analysis can help you judge whether a new market or online channel will strengthen the business or simply add workload.
Use these measures together, not in isolation. They can show where profits are made, reveal what is eroding them, and ground expansion decisions in performance rather than sales growth alone.
Key Takeaways
- Distinguish the profit measures that reveal whether revenue is translating into earnings at each stage of the business.
- Trace expenses to the products, services, and customers that drive them before deciding where to streamline.
- Protect customer experience by targeting inefficiencies instead of making broad cuts that weaken quality or service.
- Use investment returns and operating metrics to assess whether resources are generating enough value.
- Evaluate new markets and online channels against their costs, customer demand, and ability to support sustainable growth.
1. Gross profit, operating profit, EBITDA, and net profit
A practical business profitability strategy tracks profit at several stages, since each measure reveals a different source of margin pressure. Gross profit is revenue minus cost of goods sold (COGS). Operating profit, also called EBIT, is what remains after operating expenses. EBITDA adds depreciation and amortization back to operating profit. Net profit is what remains after all expenses related to manufacturing, production, and selling are deducted from revenue.
Calculate gross profit margin by subtracting COGS from net sales, dividing the result by net sales, then multiplying by 100. For example, if a product line’s margin falls, review material usage, supplier terms, and selling prices before changing the offer. Calculate operating profit margin by dividing operating income by net sales and multiplying by 100. Comparing these measures helps determine whether pressure comes from production costs or broader operating expenses.
EBITDA is operating profit plus depreciation and amortization, a calculation explained by the Corporate Finance Institute. It helps assess operating performance before those expenses are included, but it is not the same as net profit. Review all four measures together: a strong gross margin can coexist with weak operating profit if overhead consumes the difference. The U.S. Small Business Administration’s financial management guidance highlights income statements as a tool for understanding business revenue and expenses.
What steps should a small business take to create a profitability improvement plan? Start with the income statement and calculate each margin. Then identify the product, service, or workflow behind the weakest result. Set a target, assign an owner to each action, and review actual performance against the forecast regularly. This turns a broad goal into an operational plan with measurable checkpoints.
Which financial tools and software help businesses track and forecast profitability? Use accounting software to organize income statement data, a spreadsheet to model revenue and cost assumptions, and budgeting or forecasting tools to compare expected results with actual performance. Keep categories consistent across periods so margin changes reflect real shifts, not changes in bookkeeping.
Next, inspect production and service workflows for rework, idle capacity, unnecessary handoffs, and excess material use. Track rejected items against total items produced using the error-rate formula: rejected items divided by items produced, multiplied by 100. This makes waste visible and gives teams a specific process to improve without cutting product quality or customer support.
Automate repeatable tasks when the implementation cost and workflow make it practical to use resources more effectively over time. For example, automatically routing routine orders can reduce manual processing and free staff to handle exceptions that need judgment. Sustainable growth depends on preserving the quality customers value while removing avoidable work. Review margins and workflow results together to confirm the efficiency gain.
2. Cost structure analysis and expense management
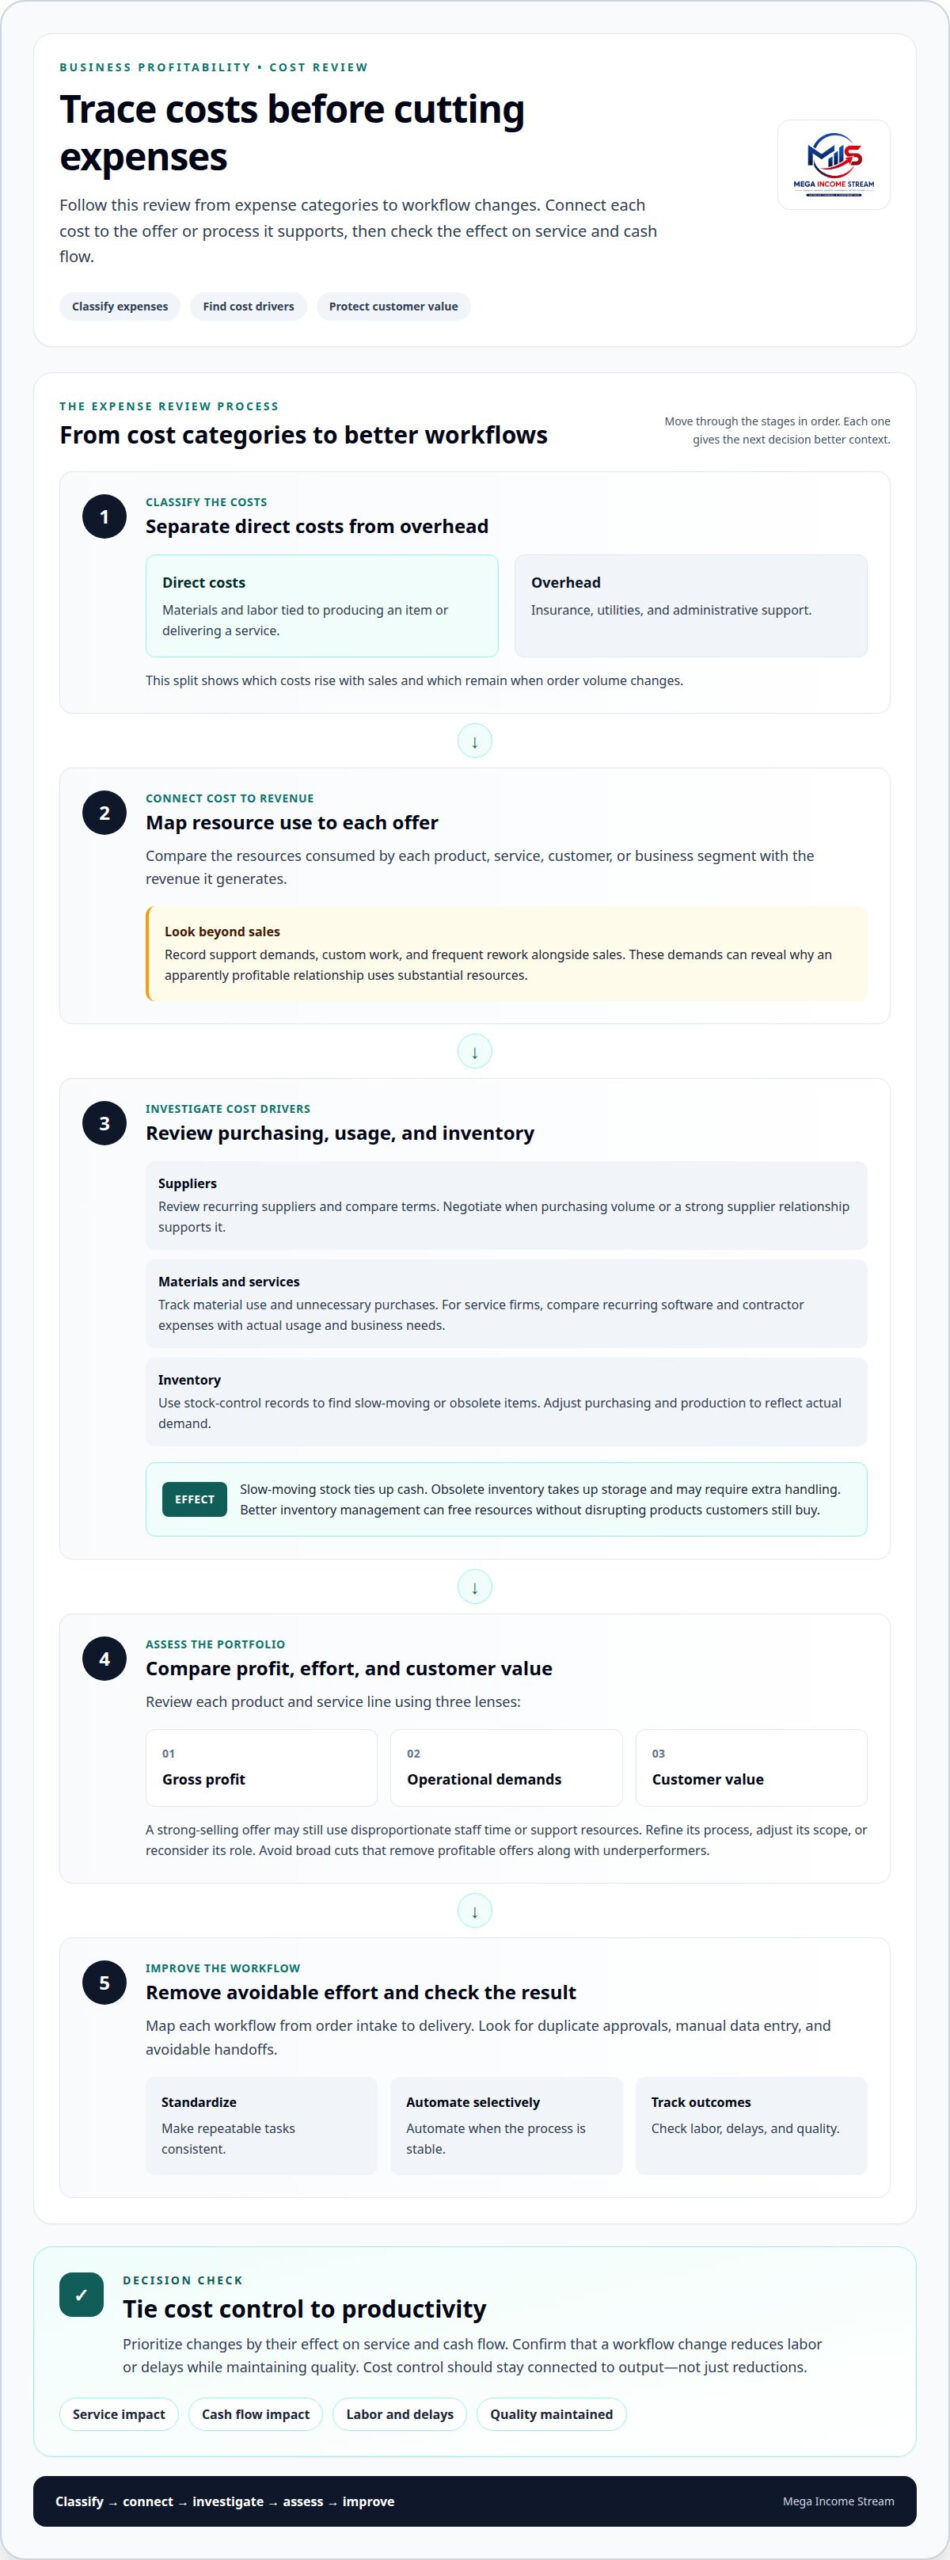
Separate direct costs from overhead before deciding where to reduce expenses. Direct costs include materials and labor tied to producing an item or delivering a service. Overhead includes expenses such as insurance, utilities, and administrative support. Categorizing both reveals which costs rise with sales and which remain even when order volume changes.
Next, compare the resources each product, service, customer, or business segment consumes with the revenue it generates. Cost-to-serve analysis can reveal a relationship that looks profitable but requires substantial support, custom work, or frequent rework. Record those demands alongside sales, then identify process changes that preserve value and reduce unnecessary effort.
Supplier terms can offer practical ways to manage direct costs. Review recurring suppliers, compare terms, and negotiate when purchasing volume or a strong supplier relationship supports it. Manufacturers can track material use and avoid unnecessary purchases. Service firms can compare recurring software and contractor expenses with actual usage and business needs.
Inventory decisions affect cash flow and operating efficiency. Slow-moving stock ties up cash, while obsolete inventory takes up storage and may require extra handling. Use stock-control records to identify items with weak movement, then adjust purchasing and production to reflect actual demand. Better inventory management can free resources without disrupting products customers still buy.
Portfolio analysis helps determine which offers merit more attention. Compare product and service lines by gross profit, operational demands, and customer value. A strong-selling offer may still consume disproportionate staff time or support resources. Refine its process, adjust its scope, or reconsider its role. Avoid broad cuts that eliminate profitable offers along with underperformers.
Tie expense management to productivity, not just reductions. Map each workflow from order intake to delivery, noting duplicate approvals, manual data entry, and avoidable handoffs. Standardize repeatable tasks or automate them when the process is stable. Track whether the change reduces labor or delays while maintaining quality. This keeps cost control connected to output.
Use a repeatable review: group expenses, assign them to products or workflows, investigate the largest cost drivers, and prioritize changes by their effect on service and cash flow. Revisit supplier terms, stock levels, and portfolio performance as operating conditions change. A focused set of business strategies for expense management can help connect these decisions to the bottom line.
3. Profitability mistakes that harm customer experience
Protect customer value while improving profitability. Cutting support, product quality, or onboarding without assessing the impact can weaken future revenue. For example, removing setup help may lower service expenses but prevent new users from getting the intended value from a product. Before making a change, identify the customer need it affects and weigh the savings against the support lost.
Start customer segmentation with an ideal customer profile informed by market research and historical customer data. Compare customer needs, purchase patterns, support demands, and revenue contribution. A segment that buys repeatedly and needs little service may warrant a different offer from one requiring extensive customization. Use these distinctions to target relevant products and promotions instead of treating every customer as equally profitable.
Customer profitability analysis should account for the resources needed to serve each segment. Review order frequency, support requests, returns, custom work, and products purchased. Then assess whether high service demands stem from an avoidable process issue or a genuine customer need. If service levels change, explain the change clearly and preserve the parts of the experience customers rely on.
What are the risks of prioritizing profitability over revenue growth? Excessive cost cutting can reduce service quality, customer satisfaction, and repeat business, weakening future revenue. Acquiring a new customer costs five to 25 times more than retaining an existing customer, so a short-term saving that damages retention can undermine long-term performance.
Increase average revenue per customer by matching added value to a real need. A relevant bundle, premium tier, or useful add-on can deepen a relationship without pressuring customers into an unwanted purchase. For example, offer a basic service tier alongside an expanded option with clearly explained benefits. Track customer responses and repeat purchases to see whether the offer adds value or complexity.
Use customer feedback and purchase patterns to refine each offer. If a promotion attracts buyers who rarely return, compare its revenue with the service and fulfillment demands it creates. Tailor campaigns to high-value segments, but do not neglect customers with growth potential. Onboarding, education, and proactive support can strengthen loyalty when they help customers use products effectively.
Finally, review customer experience measures alongside financial results. Track repeat purchases, support issues, returns, and satisfaction trends by segment. Investigate sharp changes after pricing, service, or product adjustments. This helps decision-makers distinguish sustainable efficiency from cuts that shift costs onto customers and make them less likely to stay.
4. EBITDA margin and return on invested capital
Use EBITDA margin and return on invested capital to assess operating performance and capital deployment. EBITDA margin compares EBITDA with revenue, while return on invested capital (ROIC) compares net operating profit after taxes (NOPAT) with invested capital. They answer different questions: how much operating earnings sales produce, and how effectively the business uses capital to generate those earnings.
Calculate EBITDA margin by dividing EBITDA by revenue and multiplying by 100. Calculate ROIC by dividing NOPAT by invested capital. Read both measures with the business’s operating context. A company may commit capital to equipment or technology before those assets contribute fully to earnings. Track the timing of investment alongside the operating results it supports.
Margins also show where performance shifts between production and the bottom line. Gross profit margin focuses on the relationship between net sales and cost of goods sold. Contribution margin helps assess how much revenue remains after variable costs to cover fixed costs. For example, a product with a strong gross margin may contribute less if each order requires costly packaging, delivery, or transaction handling.
Compare margin trends across product lines and reporting periods to identify changes that need investigation. If gross margin stays stable while EBITDA margin declines, review operating spending and resource allocation. If contribution margin weakens for one offer, examine its variable fulfillment or service demands. Treat the pattern as a starting point for investigation, not proof of a single cause.
Governance keeps these measures useful. Define revenue, operating earnings, NOPAT, and invested capital consistently, and apply the same definitions across reporting periods. Assign an owner to explain significant movements and document related decisions. Consistent accounting makes comparisons more useful and prevents changes in categorization from appearing to be operational gains.
Set review points against the business plan. Assess profitability annually at fiscal year-end, with regular quarterly check-ins to compare actual performance with targets. At each review, record the metric that changed, the operating decision behind it, and the next action. This connects measurement to execution instead of leaving the dashboard as a reporting exercise.
Industry comparisons need context. Profit margins vary widely across sectors, so compare businesses with similar models, capital needs, and delivery structures. A digital subscription operation and a distributor may have different asset requirements even when both report revenue growth. Use external comparisons to identify questions, then measure progress against the company’s own operating history.
For investment decisions, consider ROIC alongside relevant margin trends and operating measures. A project may increase sales but still use capital inefficiently if earnings do not keep pace. Review assumptions about expected demand, required assets, and ongoing operating support. After implementation, compare actual performance with expectations to decide whether to continue, adjust, or limit the investment.
5. Expanding into new markets and online channels
Expand when the new market fits your offer and operating model. A new channel can reach customers beyond your current base, but it changes how they discover, buy, and receive the product. Map that journey before launch. For example, a service sold through direct conversations may need clearer package details and self-serve onboarding online.
Define the opportunity by customer need, not channel popularity. Identify the segment, the problem your offer solves, and the buying process customers expect. A business entering a neighboring market might adapt an existing offer for a distinct audience. Before committing resources, assess whether the change requires new capabilities, different support, or revised fulfillment.
Assess the full operating model, including customer acquisition, payment handling, delivery, returns, support, and management time. Consider whether the new route uses existing systems or creates a separate workflow. A channel requiring duplicate data entry or manual order handling can strain operational efficiency. Map each handoff to understand the workload before demand grows.
Run a limited market test with one offer and a defined customer segment. Track qualified inquiries, completed purchases, cancellations, repeat orders, and support patterns. Compare these signals with the assumptions behind the launch. If prospects engage but do not buy, examine the offer’s relevance, product information, and checkout experience before increasing promotion.
For online channels, evaluate the journey from discovery to delivery. Check whether product pages answer common questions, checkout works smoothly, and customers receive clear order updates. For a service business, assess whether scheduling, onboarding, and communication can run reliably without constant manual intervention. These details help show whether digital reach can produce manageable demand.
Consider complementary offers when an existing capability can meet a related customer need. A specialist might package a narrower service for smaller clients, while a digital publisher could create a paid resource from established expertise. Assess delivery demands and audience fit before adding an offer. A new revenue stream should strengthen the model, not split attention across unrelated products.
Review the test against its original assumptions before widening the launch. Record which customer needs appeared, where buyers dropped out, and which tasks consumed unexpected effort. Use those findings to refine the channel, offer, or fulfillment process. If one segment responds well, improve that route before entering additional markets. Focused business expansion strategies can help connect market choices with execution priorities.
Mega Income Stream
Mega Income Stream helps entrepreneurs turn profitability analysis into practical decisions about revenue, costs, and growth. Its Business Strategies, Making Money Insights, and Consulting Business help readers identify margin pressure, assess operating choices, and evaluate expansion opportunities.
Consider this next step when your figures reveal a gap between sales growth and retained profit, or when you need to compare investment options with operating capacity. A focused review can connect margin measures with customer value, cash flow, and the resources needed to scale. This gives you a clearer basis for deciding which opportunities fit your business priorities.
Share the profitability challenge or growth decision you are working through, and contact Mega Income Stream to discuss it.
Turn profitability insight into your next move
Choose one decision that can improve the business’s next phase: strengthen an existing offer, refine an operating process, or test a new route to customers. Assign an owner, define the signal that would justify moving forward, and set a review point. This turns a business profitability strategy into a working decision system, not a static set of targets.
Keep the next move focused. A small, measurable test can reveal whether an assumption holds before it informs broader investment or expansion plans. Record what changes, how customers respond, and what the operation learns. Use those findings to refine the plan rather than scaling on momentum alone.
If you want strategic support applying these decisions to your business, contact Mega Income Stream. The next step is to turn your strongest opportunity into a clear, disciplined plan you can act on with confidence.
Frequently Asked Questions
What is profitability?
Profitability describes a business’s ability to earn more from its activities than it spends delivering them. It distinguishes an operation that generates revenue from one that creates financial value after costs. For example, a busy online store may attract many orders but still struggle if refunds, fulfillment, and customer acquisition consume its earnings. Review profitability alongside cash availability, since profit earned and cash timing answer different questions.
What is a business profitability strategy?
A business profitability strategy is a coordinated approach to improving the earnings generated by a company’s products, customers, and operations. It links decisions to outcomes rather than treating every expense or sales campaign in isolation. For example, a digital publisher might assess whether a new paid product suits its audience, delivery capacity, and revenue model before committing development resources. The strategy should set priorities, owners, and measures for reviewing results.
How do you measure business profitability and which metrics matter most?
Measure profitability with a concise dashboard suited to the decision at hand. An operator reviewing product economics might track gross and contribution margins. Leadership assessing overall performance could also review operating margin, net margin, EBITDA margin, and return on invested capital. Include cash flow and customer acquisition cost when timing or marketing efficiency matters. Compare equivalent periods and customer cohorts so seasonal shifts do not distort the signal.
What are the best ways to increase profit margins?
First locate the margin constraint, then choose a response that addresses its cause. If a service package requires repeated custom work, standardize its scope before increasing promotion. If customers value an added feature, test it as a premium option instead of raising every price. Track conversion, repeat purchases, and delivery effort after the change. This helps distinguish a genuine margin improvement from one that reduces demand or service quality.
How can businesses reduce costs without hurting quality or growth?
Protect costs that support product reliability, customer outcomes, or future capacity. Focus first on duplicated work, unused subscriptions, avoidable rework, and processes that delay delivery. For example, a team can document a repeatable onboarding workflow before automating it, reducing manual handling without removing useful guidance. Review customer complaints and delivery errors after each change. If either increases, adjust the process instead of extending the cut.
How should a business use pricing strategies to improve profitability?
Set prices based on customer value, market conditions, and the work required to deliver each offer. A business can test a higher-priced tier with new customers while keeping a simpler option for buyers with tighter budgets. Explain the differences clearly. Monitor conversion, cancellations, renewals, and customer feedback together. A price change that increases revenue per order but causes avoidable cancellations may weaken longer-term profitability.
How can businesses identify their most and least profitable products, customers, and channels?
Build a consistent view of profitability across products, customer groups, and acquisition channels. Include the costs each area creates, such as campaign spending, transaction handling, returns, support, and delivery. Compare contribution and repeat-purchase patterns rather than ranking options by revenue alone. A lower-sales channel may attract customers who return often, while a high-volume offer may require costly customization. Apply the same cost-allocation rules to every comparison.
How do industry benchmarks and profit margins vary by sector in the United States?
Profit margins vary widely by industry: money center banks average 30.89%, compared with 1.96% for grocery and food retail and -16.35% for real estate development. Businesses should compare their margins with others in their own industry.











Comments