Trading indicators are an important aspect of any technical trader’s technique. It could help you obtain additional insight into price trends if combined with the correct risk management solutions.
Whether you’re interested in forex trading, commodities trading, or share trading, using technical analysis as part of your approach – which involves understanding several trading indicators – can be beneficial. Trading indicators are mathematical computations that are represented as lines on a price chart and can assist traders in identifying specific signals and market patterns.
There are two kinds of trading indicators: leading indicators and lagging indicators. A leading indicator is a forecast signal that forecasts future price movements, whereas a lagging indicator examines historical trends to determine momentum.
Trend indicators are essential in day trading for a number of reasons. Some of these common reasons are:
To follow the trend
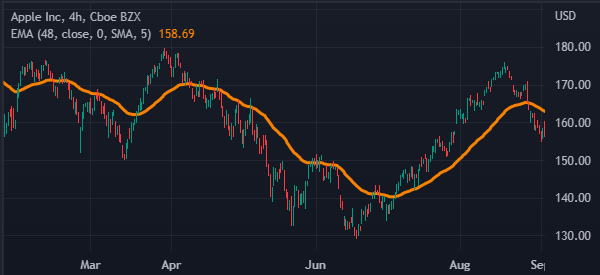
The first main reason why it is important to use trend indicators is that they help you follow a trend well. For example, in the chart below, we see that the Apple shares are rising and are above the 50-day moving average. In this case, a trader can decide to maintain the bullish trade as long as it is above the MA.
To know when to exit
This is another reason why people use trend indicators is to know when to exit a trade. Just as in the example above, one can use the moving average to know when to exit it. If it moves below the moving average and you are long, it is a sign that you should exit the trade.
To know when to buy or short
The other reason why you need trend indicators is to know when to buy or short an asset. For example, you can use moving average strategies like a golden cross and a death cross to identify when to buy or sell an asset. A golden cross happens when the 200-day and 50-day moving averages make a crossover.
To identify stop-loss and a take-profit
Finally, trend indicators can help you identify areas to place your stop-loss and take-profit. In some cases, you can place a stop-loss at the 50-day or a 25-day moving average.
Below we provide you with some of the best indicators for trading.
Moving Average
Moving averages are the most popular indicators in the market. In fact, they form the foundation of other indicators like Bollinger Bands and MACD. There are several strategies of using moving averages, including reversals. But the most popular one is in trend trading. This is where you add a moving average on a chart and hold the trade so long as the price is above or below this moving average.
In the chart below, a trend trader would have continued to hold the Alphabet shares so long as the price was above the 50-day exponential moving average (EMA). Other types of moving averages uses are simple, smoothed, and hull, among others.
MACD
The Moving Average Convergence Divergence (MACD) is an oscillator that is derived from two moving averages. By default, the fast MA has a length of 12 while the slow MA has a length of 26. The MACD is popularly used in trend following and in reversals trading strategy.
In reversals, the signal emerges when the two moving averages make a crossover below the neutral line. When a bullish trend is on, the two lines keep rising, with the signal line being lower than the MACD line. After crossing the neutral line, the two lines must remain there during a bullish trend.
Relative Strength Index (RSI)
The Relative Strength Index (RSI) is the most popular oscillator in the financial market. You have probably heard more about it in popular financial trading shows, including by Jim Cramer. The indicator identifies the momentum of assets like stocks, currencies, and exchange-traded funds (ETFs).
Read Also: Trade Off in Business Life
In most cases, the Relative Strength Index is used to identify overbought and oversold levels. An asset is said to be extremely overbought when its price has been in an extended period of gains. It is said to be oversold after falling substantially over time,
As you may have guessed from the main topic of the article, You can use the RSI indicator in trend following as well. Buy signals emerge when the indicator keeps moving upwards while sell signals come out when the indicator keeps falling.
Bollinger Bands
Bollinger Bands is an indicator that is derived from moving averages and standard deviation. The middle line of the indicator is the moving average of a certain period while the upper and lower line are the standard deviations. In most cases, the moving average used is usually 20 while the standard deviation is 2 (with 0 offset).
Bollinger Bands are mostly used in trend following strategy. In most cases, during an uptrend, the price usually remains between the middle and upper lines of the indicator. Therefore, the idea is to buy so long as the price is between these two lines.
On the other hand, sell signals emerge when the price is between the lower and the middle line. A bearish trend will be strong when the price is along the lower line of the bands.
Ichimoku Kinko Hyo
The Ichimoku Kinko Hyo is the scariest technical indicators in the market. However, experienced traders view it as one of the easiest-to-use and one of the most accurate. The indicator is made up of several lines, including the conversion, baseline, lagging span, and lead 1 and 2.
There are several strategies for trading using the Ichimoku cloud. For example, you can identify reversals when the conversion and base lines make a crossover. You can also use it in trend following. You can use two main approaches to this.
First, you can use the Ichmoku cloud. A bullish trend remains in a bullish view when the price is above the Ichimoku cloud. Second, you can use the lagging line. In a bullish trend, the price will be above the lagging line.
Stochastic Oscillator
The Stochastic is a popular oscillator that is mostly used to identify overbought and oversold levels. The indicator has two lines that are known as %D and %K. It also has the upper band and lower band, which are at 80 and 20.
In most cases, buy signals emerge when the two lines make a crossover below the lower band while sell signals are made when there is a crossover above the upper band. After the crossover, the bullish trend remains as long as the two lines are moving upwards and vice versa,
Stochastic Oscillator
The Stochastic is a popular oscillator that is mostly used to identify overbought and oversold levels. The indicator has two lines that are known as %D and %K. It also has the upper band and lower band, which are at 80 and 20.
In most cases, buy signals emerge when the two lines make a crossover below the lower band while sell signals are made when there is a crossover above the upper band. After the crossover, the bullish trend remains as long as the two lines are moving upwards and vice versa.
Advance-Decline Line (ADL)
The Advance-Decline Line is an indicator that is popularly used to trade indices like the Dow Jones and the S&P 500. The indicator is calculated by looking at the number of advancing stocks and those that are falling in a session.
If the number of advancing shares is more than those that are falling, the indicator will keep rising, and vice versa. If the indicator is falling even as the indicator rises, it tells you that the rally is being controlled by just a few companies.
On Balance Volume (OBV)
The On Balance Volume is an indicator that is relatively similar to the ADL. Instead of looking at the number of advancing and falling stocks, it looks at their volume (a very important point for day traders).
Ideally, a bullish trend remains intact as long as the On-Balance-Volume is rising and vice versa.
Average directional index (ADX)
The ADX illustrates the strength of a price trend. It works on a scale of 0 to 100, where a reading of more than 25 is considered a strong trend, and a number below 25 is considered a drift. Traders can use this information to gather whether an upward or downward trend is likely to continue.
ADX is normally based on a moving average of the price range over 14 days, depending on the frequency that traders prefer. Note that ADX never shows how a price trend might develop, it simply indicates the strength of the trend. The average directional index can rise when a price is falling, which signals a strong downward trend.
The first rule of using trading indicators is that you should never use an indicator in isolation or use too many indicators at once. Focus on a few that you think are best suited to what you’re trying to achieve. You should also use technical indicators alongside your own assessment of the movements of an asset’s price over time (the ‘price action’).
It’s important to remember that you have to confirm a signal in some way. If you’re getting a ‘buy’ signal from an indicator and a ‘sell’ signal from the price action, you need to use different indicators, or different time frames until your signals are confirmed.
Another thing to keep in mind is that you must never lose sight of your trading plan. Your rules for trading should always be implemented when using indicators.
What Indicator Tells You When to Buy And Sell?
George Lane invented stochastics in the late 1950s, an indicator that examines the relationship between an issue’s closing price and its price range over a predetermined time period. Stochastics are still a popular technical indicator because they are simple to comprehend and have an excellent track record of predicting whether it is time to buy or sell a security.
Price Action
The premise of stochastics is that when a stock trends upwards, its closing price tends to trade at the high-end of the day’s range. For example, if a stock opened at $10, traded as low as $9.75 and as high as $10.75, then closed at $10.50 for the day, the price action or range would be between $9.75 (the low of the day) and $10.75 (the high of the day). Conversely, if the price has a downward movement, the closing price tends to trade at or near the low range of the day’s trading session.
Stochastics is used to show when a stock has moved into an overbought or oversold position. Fourteen is the mathematical number most often used in the time mode. Depending on the technician’s goal, it can represent days, weeks, or months. The chartist may want to examine an entire sector. For a long-term view of a sector, the chartist would start by looking at 14 months of the entire industry’s trading range.
Relative Strength Index (RSI)
An example of such an oscillator is the relative strength index (RSI)—a popular momentum indicator used in technical analysis—which has a range of 0 to 100. It is usually set at either the 20 to 80 range or the 30 to 70 range. Whether you’re looking at a sector or an individual issue, it can be very beneficial to use stochastics and the RSI in conjunction with each other.
The K line is faster than the D line; the D line is the slower of the two. The investor needs to watch as the D line and the price of the issue begin to change and move into either the overbought (over the 80 line) or the oversold (under the 20 line) positions. The investor needs to consider selling the stock when the indicator moves above the 80 levels. Conversely, the investor needs to consider buying an issue that is below the 20 line and is starting to move up with increased volume.
Over the years, many articles have explored “tweaking” this indicator. But new investors should concentrate on the basics of stochastics.
:max_bytes(150000):strip_icc():format(webp)/dotdash_Final_Stochastics_An_Accurate_Buy_and_Sell_Indicator_Oct_2020-01-61f4fc026ca648db862f4757e87a3261.jpg)
In the chart of eBay above, a number of clear buying opportunities presented themselves over the spring and summer months of 2001. There are also a number of sell indicators that would have drawn the attention of short-term traders. The strong buy signal in early April would have given both investors and traders a great 12-day run, ranging from the mid $30 area to the mid $50 area.
In technical analysis, stochastics refers to a group of oscillator indicators that point to buying or selling opportunities based on momentum. In statistics, the word stochastic refers to something that is subject to a probability distribution, such as a random variable. In trading, the use of this term is meant to indicate that the current price of a security can be related to a range of possible outcomes, or relative to its price range over some time period.