In the same way that a handyman requires a toolbox full of hammers, nails, and screwdrivers, people who want to work in business intelligence (BI) need to know how to use specific software tools. Business intelligence encompasses the methods, plans, and resources that organizations employ to gather, handle, and evaluate data.
Based on insights discovered, business intelligence technologies can help firms find new ways to increase ROI and gain a competitive edge. Examine one of these instruments to advance your profession; they are utilized by company users, departments, and industries alike.
APIs, automation, artificial intelligence (AI), and other technologies are used by business intelligence (BI) software to streamline the collection, organizing, analysis, and visualization of data. It practically does everything for you, save for making decisions, given facts.
While many platforms claim to be BI or BI-related technologies, not all of them enable you to extract meaningful insights from your data and are still usable by companies of all sizes.
Table of Content
- What is a Business Intelligence (BI) Tool?
- List of Top 13 Business Intelligence Software
- Wyn Enterprises
- Zoho Analytics
- Qualtrics Research Core
- Ortto
- Sisense
- Looker
- Periscope Data
- Reveal
- Board
- ActiveBatch
- Pecan
What is a Business Intelligence (BI) Tool?
Large volumes of structured and unstructured data are gathered, processed, and analyzed by business intelligence tools from both internal and external sources. Documents, photos, emails, movies, books, journals, posts on social media, files, and more can all be considered data sources. BI solutions employ queries to retrieve this data and then display it in ways that are easy for users to understand, like reports, dashboards, charts, and graphs.
Data mining, data visualization, analytics, reporting, predictive analytics, analytics, text mining, and many more tasks can be carried out by the technologies. Employees can use this data to their advantage by using key performance indicators (KPIs), market trends, and predictions to help them make better decisions.
Benefits of BI Software
BI tools can help your business take smart, agile steps toward accomplishing bigger goals.
- Centralized data: All of your data, in one place. Companies collect data from numerous databases, portals, customer relationship management (CRM) systems, enterprise resource planning (ERP) systems, and more. To make sense of it all, you’ll need business intelligence tools to pool the data together and deliver certain types of views (issues, trends, analytics) based on your queries or what you want to know.
- Self-sufficiency: Data no longer just belongs to your company’s IT team. Now, any employee without technical expertise, even interns, can access and analyze data necessary for their respective teams. They can generate reports on all electronics sales in 2020 or visualize patient records to identify the number of COVID-19 cases in 2022.
- Make predictions: With access to so much data from the past and present, employees can make evidence-based decisions. Predictive analytics and forecasting enable users to generate insights based on a product or service’s performance history. If a business condition changes, the intelligent tools can automatically figure out the anomalies and you’ll be able to react to disruptions as they arise.
- Automatic reports: Instead of inputting data manually into Excel spreadsheets or toggling between different tools, many BI tools are automated. If you need a report on a product over a specific period of time, the tool will generate that for you. If that information is significant and you want to add it to a presentation, you can create interactive visualizations and download any charts or graphs you may need.
- Reduces business costs: BI tools can do so much, from analyzing consumer behavior and sales forecasting to real-time process monitoring, that analyzing, planning, and reporting processes are way more efficient and accurate than ever before. In fact, more than 50 percent of BI tools users reported that these benefits helped them reduce costs and increase revenue
List of Top 13 Business Intelligence Software
There are numerous BI tools accessible today. These were the websites that were most frequently cited when ranking the top BI tools in order to determine which was best. There is no specific order in which these BI tools are ranked.
1. Wyn Enterprises
With easy-to-use designers, designed for self-service BI, Wyn offers limitless visual data exploration, allowing the everyday user to become data-driven while revealing trends and telling the story behind the data.
Whether for your business or your commercial SaaS app, Wyn is an ideal solution for both. Embedded BI for your business provides a holistic view of your business and can lead to more insights, increased team collaboration, and overall business growth. Additionally, embedding Wyn in your SaaS app provides white-label reports and dashboards as part of your own app. Embed Wyn and empower your users with a seamless business intelligence solution.
One thing that makes Wyn Enterprise unique is how it is licensed. Wyn’s server-based licensing means no user fees or limits on data size. From a single Wyn licensed server, an organization may embed Wyn Enterprise in an unlimited number of applications with an unlimited number of end-users, for a flat fee. Server-based licensing allows you to scale your business and the user base — with no additional cost.
Features:
- Seamlessly embedded Business Intelligence
- Self-service BI dashboard and reports
- Built-in multi-tenant support
- Date governance and modeling
- Extensible security
- Specialized web portals
- Pixel-perfect reports
- Efficient Report Sharing
- Centralized storage
Built for self-service BI, Wyn offers limitless visual data exploration, creating a data-driven mindset for the everyday user. Wyn’s scalable, server-based licensing model allows room for your business to grow without user fees or limits on data size.
2. Zoho Analytics
If you’re a solopreneur looking for a free BI tool to help you manage and analyze your data, Zoho Analytics has you covered. With its Personal plan, you can download the platform to your local server for free and access some powerful features many BI tools would charge for—conversational AI, unlimited reports, predictive analytics, and more.
Not everyone can (or wants to be) an expert in BI. For the novices in the crowd, Zoho Analytics is also among the easiest options to pick up. It offers simple walk-throughs and demo videos to help you get up and running, and the interface is simple enough to navigate without much of a learning curve.
Many have used Zoho’s AI assistant Zia via the other apps in its suite of tools, but it was still the most impressive part of the app to me. Not only will Zia generate a formula to manipulate your data exactly how you need it to, but it will also be able to perform predictive analytics based on natural language. I asked it what my revenue would be at a certain point in time, and it generated a written and graphic breakdown of its prediction.
Zoho products are pretty notorious for having a relatively outdated-feeling interface, but in the case of BI software, it doesn’t really matter. Most platforms in this category haven’t quite nailed down the chic, modern interface of the mid-2020s, so Zoho fits right in.
While it integrates seamlessly with other Zoho apps, if you can’t find the integration you need in the Zoho suite, Zoho Analytics integrates with Zapier, opening the door to tons of automation. Funnel leads from your ad tool directly into Zoho, or connect it to your favorite spreadsheet app, so your newly inputted data gets automatically imported.
Zoho Analytics pricing: Offers a free on-premise plan; from $24/user/month, billed annually, for the Basic plan
3. Qualtrics Research Core
Qualtrics CoreXM is a survey management tool designed to help businesses collect feedback across multiple platforms and provide insight into brand awareness and consumer preferences. Key features include customer segmentation, sentiment analysis, trend alerts, predictive behavior analytics, real-time response monitoring, data insight reports, and more.
With the Qualtrics’ survey tool, businesses can use the drag and drop interface, multiple question formats, and pre-built templates to create custom surveys and questionnaires. Users can collect feedback across multiple platforms, such as mobile devices, apps, websites, and chat boxes, which enables companies to optimize customer engagement, improve response rates, and act on insights.
The centralized platform uses AI and machine learning to monitor survey responses in real time, flag poor quality responses, and offer recommendations for improvement. The software scans text responses and provides businesses with sentiment analysis, trend alerts, behavior forecasts, and research data reports. With Qualtrics CoreXM’s conjoint analysis features, companies can review feedback according to customer demographics, such as age, gender, and background to determine the optimal product configuration, starting price, and target audience.
Strategy & Research features
- AB Testing
- API
- Access Controls/Permissions
- Activity Dashboard
- Activity Tracking
- Ad hoc Analysis
- Alerts/Notifications
- Assessment Management
- Audience Targeting
- Behavior Tracking
- Benchmarking
- Campaign Segmentation
- Categorization/Grouping
- Change Management
- Charting
- Collaboration Tools
- Competitive Analysis
- Conditional Logic
- Customer Profiles
- Customer Segmentation
- Customizable Branding
- Customizable Fields
- Customizable Questions
- Customizable Reports
- Customizable Templates
- Data Analysis Tools
- Data Coding
- Data Collection
- Data Import/Export
- Data Storage Management
- Data Visualization
- Drag & Drop
- Email Management
- Email Marketing
- Email Reminders
- Engagement Tracking
- Face-to-Face
- Feedback Management
- Funnel Analysis
- Heatmaps
- Landing Pages/Web Forms
- Market Data Analysis
- Media Analytics
- Mixed Methods Research
- Mobile Survey
- Monitoring
- Multi-Channel Distribution
- Multi-Language
- Multimedia Support
- Multiple Data Sources
- Multiple User Accounts
- Multivariate Testing
- Offline Access
- Offline Response Collection
- Panel Management
- Paper-Based
- Performance Metrics
- Phone-Based
- Predictive Analytics
- Predictive Pricing Models
- Pricing Analytics
- Product Data Management
- Profitability Analysis
- Pulse Surveys
- Qualitative Comparative Analysis
- Quantitative Analysis
- Question Branching
- Question Library
- Question Piping
- Randomization
- Real Time Analytics
- Real Time Data
- Real Time Monitoring
- Real Time Reporting
- Reminders
- Reporting & Statistics
- Reporting/Analytics
- Response Quotas
- Response Validation
- SSL Security
- Search/Filter
- Sentiment Analysis
- Single Sign On
- Site Intercept Survey
- Skip Logic
- Social Media Integration
- Social Media Monitoring
- Split Testing
- Statistical Analysis
- Support Audio/Images/Video
- Survey Builder
- Survey Sample Management
- Survey/Poll Management
- Surveys & Feedback
- Tagging
- Template Management
- Text Analysis
- Third Party Integrations
- Trend Analysis
- URL Customization
- User Research Analysis
- Visual Analytics
- Visual Editor
- Web Tracking
- Website Monitoring
- Widgets
4. Ortto
Ortto is a dedicated marketing automation platform that’s made a real name for itself since it launched in 2012. Instead of trying to offer every marketing tool a business could ever need, Ortto focuses entirely on providing powerful, yet usable automation features that any business can pick up and use – without writing any code.
In other words, Ortto is an automation specialist and this means it really needs to deliver some class-leading tools and features to justify its claim as the perfect balance between power and ease-of-use.
First, let’s take a look at the pros and cons we’ve experienced while using Ortto. This will give you an idea of which way this review is going and provide you with a quick snapshot of its strengths and weaknesses.
Here are the main points we’ll be highlighting throughout this review:
Ortto pros
- Excellent automation features
- Usability
- Automation templates
- Easy collaboration
- Automate actions between apps (similar to Zapier)
- Strong integration options
Ortto cons
- No built-in CRM
- Room for more analytics & reporting
- Cheaper options available
As soon as you start using Ortto, you realize this is a serious piece of software, even if its design has a bright and friendly appeal to it. This visual design concept is a key part of its code-free automation experience, which makes the complex world of building automated workflows as easy as we’ve ever seen from a tool like this.
Read Also: List of Business Intelligence Software Companies
The drag-and-drop builder means anyone can pick up the tool and start creating their own workflows. But the thing we loved most about Ortto is how much easier it is for teams to collaborate on the same workflow. Team members can annotate sequences with notes, emojis and stickers to provide contextual meaning for their colleagues.
The notes and graphics make it so much easier to understand the logic of a workflow someone else created – something that can take hours to decipher without explanation. This feature alone makes it so much easier for us to collaborate on automation workflows, debug and provide feedback.
So we know that Ortto delivers in terms of quality and we’ve already mentioned that it’s not the cheapest option on the market. It’s not that the monthly fees themselves are particularly expensive but more to do with the low thresholds for contacts before you’re moved up to a more expensive plan.
Let’s take a look at the numbers.
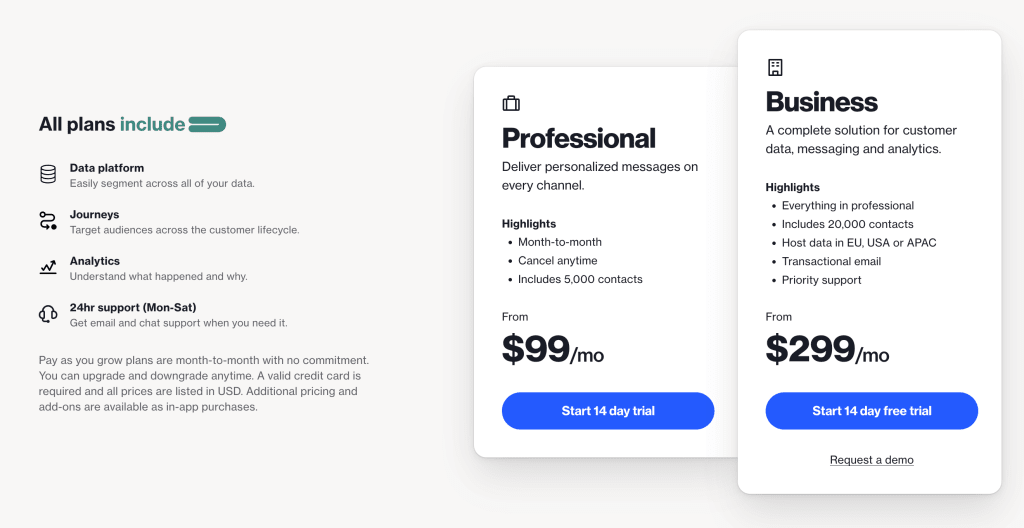
If you pay monthly with no contractual agreement, you’re looking at the following fees:
- Professional – $99 / mo for 5,000 contacts
- Business – $29 / mo for 20,000 contacts
You can send unlimited emails on both plans and you get access to all Ortto’s features. Unlike most software providers, the company doesn’t limit access to its more advanced features on cheaper plans. You can bring the total cost of your plan down by committing to a year-long contract and further still by paying for the full year in advance.
Either way, you’re soon going to find yourself bumped up to the Business plan and once you have more than 20,000 contacts, you’ll have to negotiate a deal with the company’s sales team. The good news is that, by this stage, you’ll start to get better value, pound for pound.
Also, keep in mind that software like this is designed to save and make you more money than it costs.
5. Sisense
Sisense is one company gathering new momentum in the self-service business intelligence (BI) space. In September 2018, the company announced a new $80 million investment from New York-based venture capital (VC) firm Insight Venture Partners. If you are familiar with BI tools, then you’ll likely be impressed with Sisense (which is priced only by custom quote). It’s an attractive product with substantial power. Still, Sisense lacks the brand recognition of other BI heavyweights such as IBM Watson Analytics and Microsoft Power BI. But with its intuitive user interface (UI) and the significant depth of its data visualization capabilities, Sisense is seriously worth consideration.
While its UI and commands are nowhere near as familiar as those of Microsoft Power BI, it is a serious threat to Tableau Desktop given its top-shelf functionalities, such as in-chip rather than in-memory processing, and natural language commands and queries you can use inside third-party apps such as Microsoft Skype and Slack. Seriously, you can ask a question in Skype and Sisense will answer you in Skype. That’s enough to make even IBM Watson Analytics sit up and take notice.
Unlike other self-service BI apps, the value of visualizations in Sisense is not in the number of designs and formats from which you can choose but in the depth of insights they expose. In short, the multidimensional widgets render interactive, “drill to anywhere” visualizations that provide lots of insights by simply scrolling the mouse over them or clicking on different sections. Sisense also lets users reposition and resize visualizations on dashboards prior to sharing so that they are easier to read in either email or feed modes, making it ideal for viewing on multiple devices.
We would argue, however, that the available depth of its visualization might be the most significant differentiator for Sisense. This mean that an analyst or a lay user could easily discover more than they originally expected from any given analysis, without any further effort. But for this benefit to be fully realized in a data-democratized organization, Sisense first needs to make it easier for lay users to get to this point.
6. Looker
Looker is a self-service business intelligence (BI) tool that is focused on solving one particular problem: keeping track of your various Structured Query Language (SQL)-based and NoSQL Big Data sources. Looker, which begins at $3,000 per month for 10 users, actually comes to the BI world from a different direction than many of its competitors in this review roundup, including Editors’ Choice award winners Microsoft Power BI (Visit Site at Microsoft Power BI) and Tableau Desktop (Visit Store at Tableau) . Instead of trying to make pretty visualizations, Looker forces you to understand your data structures and relationships from the SQL command line.
Yes, there are a lot of tools that can take your Microsoft Excel ($99 Per Year at Microsoft 365 for Business) spreadsheets and make interesting graphics, but Looker doesn’t do Microsoft Excel and its visualizations are more of an afterthought than a destination. Yes, Looker has data dashboards and ways to edit your charts to make them more compelling, but what you will mostly end up doing in Looker is spending time writing SQL code to examine your data and collaborate across your company to build better data models about your business. It is a subtle but important distinction and requires some solid SQL knowledge if you are going to get the most out of this tool.
Looker is proficient in both SQL and Web-based data, which is no small feat. It supports more than 25 different variations, including support for Google BigQuery, Hive, Spark, and Vertica. This isn’t as broad a reach as Domo (Get Price Quote at Software Advice) but understandable given that the product is fairly new. However, it is already being used in some very large installations, with hundreds of seats consuming petabytes of monthly data.
Looker is exclusively a Web service running in your browser. The app is responsive so there is a single version that will support tablets and smartphones as well as desktops and laptops. There is no additional software to download, and it ran fine on a variety of browsers (including Microsoft Edge) in my tests.
You can place limits on the number of rows displayed while you are building your model so you won’t overwhelm your browser with your queries. When you are ready to analyze your entire data set, it is a simple operation to remove these limits. There are no actual limits on the physical size of the data set that you can work on; some Looker customers routinely examine databases with millions of rows.
Collaboration and Visualization
Looker offers left-side menus for general activities such as exploring your data, administering your account, and creating new workspaces. To create visualizations, there’s a display of the data schema where you can drag and drop elements and see what SQL code is generated as a result. The app has three different access roles: Administrator, Developer, and ordinary User. That is not as granular as Tableau Desktop but is, at least, a good start.
And while Looker’s SQL focus makes it sound like it’s a tool aimed mainly at technical personnel, the company is working hard to make the software viable to a more general audience, too. From a straight data visualization perspective, Looker has become much more flexible over the last year, for example, allowing multi-sized objects on the dashboard and adding a new mapping feature.
And, unlike many BI tools that focus primarly on exporting their visualizations for use in other apps, Looker actually placed some emphasis on importing visualizations, too, allowing customers to use Javascript to import outside visuals into Looker dashboards or simply import an outside image and overlay Looker plot data on top. Looker also supports Webhooks, which let you use Looker data objects as part of third-party workflows, like those created with Zapier.
- Pricing
Looker’s price ranges from $3,000 to $5,000 per month for 10 users. Additional users are $50 per month. This puts it among the more expensive tools in this review roundup—and probably out of reach of the smallest businesses. Looker comes either as a hosted service or as a Java Archive package that can run on your own servers if you want that control.
If your business generates Big Data and you have a SQL guru on staff, then Looker is a powerful BI tool of choice. Its mix of SQL and LookML muscle with drag-and-drop data elements is impressive as are its extensive collaboration options.
7. Periscope Data
Periscope Data is an analytics platform that helps you gather different information from different sources to create insights that you can turn into policies and actions. What’s nice about the platform is that it supports three languages: SQL, Python, and R. With these, not only can you test your models but also visualize your data for easy sharing. Furthermore, you can process more advanced analytics operations using these languages in one single platform.
Recently, Sisense bought Periscope Data. This move only increased its already comprehensive set of features especially its list of integrations. It’s now faster and can deliver a single truth across your data sources. This processing speed is regardless of size, complexity or concurrency.
Also, thanks to its flexibility, you can create and customize your own visualizations that are tailor-made for your company. Furthermore, data and insights can be easily shared through the platform. This is why Periscope Data by Sisense is being used by top companies such as Adobe and Crunchbase. It is being offered via a quote-based plan.
Benefits
- Easy-to-use and Comprehensive Analytics
Periscope Data by Sisense does not only help you collect and analyze data proficiently. It lets you do this with relative ease thanks to its very intuitive user interface. Also, its powerful features allow you to create models and test them in order to benchmark your generated insights and future policies. Thanks to Periscope Data being friendly to SQL, Python, and R, you can also easily make visualizations of complex filtered data that are shareable and relatable.
This means that you can create detailed reports. Also, your colleagues can create reports according to metrics that matter most to them. In this way, your organization can get a holistic view of pain points and opportunities surrounding it. Furthermore, these reports are easily generated within the system and you can share them in different formats.
With ease-of-use and powerful analytics combined in a platform, Periscope lets you write codes and create visualizations even if you have limited programming skills. Because of its power, you can save time and concentrate more on extracting relevant insights that you can use to act in the future. This is all made simple by easy controls including the drag-and-drop interface for calculations and choosing a variety of charts.
- Query Management Made Easy
Because Periscope Data supports SQL, Python, and R, you can make queries in these three different languages. Furthermore, in the SQL editor, you will find a comprehensive revision history for utmost control. There are also functions that make your life so much easier such as the snippet function, exploration function, and the autocomplete feature. Also, you get a built-in statistics summary to get you acquainted with relationships and trends without manually browsing every data point.
Thanks to its R and Python support, you can create visualizations much easier. Also, because of such capability, you can even reuse codes that save you time from manually entering them. Furthermore, the platform enables you to employ not just prototyping but also natural language processing. Therefore, queries are just as seamless as they come.
- Reports and Collaboration
Periscope Data does not only allow you to create reports but also allows you to create them with colleagues. The platform allows data professionals to work together in filtering, manipulating, and visualizing data for actionable insights. This is all in a single end-to-end platform serving as a centralized hub for different data sources.
Furthermore, your data professionals are not only allowed to collaborate with each other but also with the departments that handle the processes that they support. Thanks to the different kinds of charts available on the platform that range from box plots to radar charts and waterfalls. Moreover, teams can choose to create text overlays to highlight specific data that they feel is relevant in various processes.
Reports can also be synthesized in various ways easily. Again, this is because of powerful analytics computations and templates that are built into the system. This allows for quick report generation and insight creation across your organization. Add in the shareability of such data, you get a platform that doesn’t only churn out reports but also a tool that gets the conversation going inside your organization. From these collaborative sessions, you get more chances to create new knowledge and ways of looking at familiar data.
Additionally, with Periscope Data you get unlimited members free of charge.
- Security of Information
What’s the use of information for building a competitive advantage if it is already compromised? Not that much. This is why Periscope Data is built to be secured using HIPAA-HITECH and SOC 2 Type II certifications. It’s not only that. You also get controls like the aforementioned permission system. You also get an intrusion detection function and a data recovery feature. Moreover, you get an incident management system to boot. You can rest assured that your data is also encrypted and safe from malicious agents.
8. Reveal
Reveal’s AI-powered ediscovery platform that can to extract unstructured and structured data from text using a range of natural language processing. Using integrated model libraries, users can easily classify documents by identifying the main topics being discussed in the text. Users can also use built-in image classification to identify all of the images contained within emails or documents. Their sentiment analysis engine can also empower businesses to understand the tone of your communications.
With so many options available to accelerate and prioritize review, you need a review tool that seamlessly provides search, filtering, and document organization features that enable you to efficiently manage the entire process from batching to production.
- Accelerated Efficiency
Review large amounts of data accurately and efficiently with Reveal’s intuitive user interface. Dramatically reduce project startup time with easy-to-use case templates that include default project settings to accommodate your case needs.
Minimize keystrokes and shorten the UI learning curve with the industry’s best user experience. Easily eliminate low value data so you can maximize your review resources.
- Foreign Language Ready
Detects and translates 160 different business languages including the identification of up to three languages per document. Reveal offers the flexibility for you to change the language within the review interface so you can review documents in your native language.
- Image Recognition & Labeling
Reveal’s modern image detection technology leverages machine learning to automatically identify and apply descriptive labels to images. These descriptions can easily be used to facilitate image search and filter eliminating the time consuming process of manually reviewing every image.
With Reveal’s Image Labeling, you can dramatically reduce the time and cost associated with the image review process.
- Audio & Video Transcription
Reveal’s review platform gives you the ability to automatically transcribe audio and video files into searchable text enabling your review team to easily search these traditionally problematic file types.
You can rapidly identify potentially high-value content while significantly reducing the manual effort associated with media file review. Reveal’s transcription feature can also enable you to effortlessly follow the synchronized text while watching or listening to depositions.
- Active Learning
Document coding decisions can be used to inform AI models with zero extra effort. Reveal can automatically uncover similar documents with key facts earlier on in the review process. The newly identified high value data can then be automatically prioritized for attorney review within the queue.
9. Board
Board is the Intelligent Planning Platform that offers smarter planning, actionable insights and better outcomes for more than 2,000 companies worldwide. Board allows leading enterprises to discover crucial insights which drive business decisions and unify strategy, finance and operations to plan smarter and achieve full control of performance across the entire organization. With Board, companies can manage and control their entire planning process from goal setting down to operational execution in one, user-friendly environment.
Partnering with Board, global enterprises such as H&M, BASF, Burberry, Toyota, Coca-Cola, KPMG, and HSBC have deployed end-to-end planning applications at a fraction of the time and cost associated with traditional solutions. Board International was founded in 1994 and now has 25 offices around the world and a global reseller network. Board has been implemented in over 100 countries.
Board International has long been recognized by leading analysts and subject matter experts including Gartner, Nucleus, and Dresner.
10. ActiveBatch
ActiveBatch is an extensible, highly reliable workload automation tool from Redwood Software. ActiveBatch provides a central IT automation hub for assembling and monitoring end-to-end workflows in data warehouses and across the enterprise. ActiveBatch includes hundreds of direct integrations with major IT and business platforms and a Super REST API Adapter so you can connect to any server, any application or any service.
Orchestrate your entire tech stack so that business-critical systems such as data warehousing, CRM, ERP, supply chain management, work order management, project management and consulting systems work together seamlessly with minimal human intervention.
The job scheduler is the brain of workload automation architecture, allowing you to build and orchestrate cross-functional workflows. It handles load balancing, scheduling, dependency checking, SLA monitoring, reporting and notifications.
Eliminate manual workflows with ActiveBatch automated tasks and accelerate development of high-value services that drive your company forward. ActiveBatch includes a low-code drag-and-drop GUI with dozens of DevOps features to easily build end-to-end business processes in half the time without the need for custom scripting.
Users can securely access ActiveBatch from any device with flexible interfaces such as a self-service portal for business and help desk users. ActiveBatch’s proactive support model includes 24/7 global support and predictive diagnostics using AI to keep your environment optimized for reliability and productivity.
Features
- Low-Code GUI
Focus on the function, rather than the coding of workflows using hundreds of production-ready Job Steps and an intuitive graphical development environment.
- Job Step Library
A rich content library consisting of hundreds of production-ready Job Steps – out-of-the-box building blocks for commonly scripted actions and functions – ready for assembly into IT and business workflows.
- Event and Schedule Driven Triggers
Reduce slack time and improve job success rates with ActiveBatch’s rich, event-driven architecture and advanced, customizable date/time scheduling options.
- Dynamic Resource Allocation
Get seamless machine scalability with machine learning models that analyze historical instance data and predict optimal systems and virtual machine allocation.
- Change Management Tools
Ensure a highly reliable approach to managing objects across different scheduling environments. Included in the core license, these tools give you the ability to easily move workflows between Dev and Production.
- High Availability Non-Cluster Failover
Experience reliable high availability in the event of a potential outage or failure. Jobs and plans are redirected to standby systems so they are completed on or near schedule.
- Workflow Optimizer
Immediately highlight every workflow’s critical path with a push of a button, allowing you to speed up run times by running non-dependent steps concurrently.
- Role-Specific Views
Role-specific views let every department focus on the metrics that matter most. The Operations view shows job progress and status. Map View makes it easy for developers to build and optimize workflows.
- Self-Service Portals
Democratize automation within IT and for your user community with self-service portals.
- Security
ActiveBatch supports the Windows Security Model, including Kerberos and Active Directory, allowing organizations to manage access with their existing accounts and groups.
- Auditing & Compliance
Implement policy-driven governance throughout with capabilities such as revision history, policy authorizations, auditing, and advanced SLA management.
- Reporting & Monitoring
ActiveBatch gives you the critical data you need to monitor and optimize your IT and business operations. Stay ahead of issues using proactive monitoring and alerting, delivered in a variety of channels.
11. Pecan
Pecan AI automates predictive analytics to solve today’s business challenges: shrinking budgets, rising costs, and limited data science and AI resources. Pecan’s unique predictive GenAI provides AI-driven predictive analytics that enables data and business teams to achieve their goals.
With an intuitive predictive chat and SQL-based predictive notebook, analysts set up accurate models, without any data science background. The platform enables easy implementation of classification and regression predictive models, such as customer churn, demand forecasting, LTV, predictive maintenance, and many more. The platform automates data prep, feature engineering, model building, deployment, and model monitoring.
Individual-level predictions offer granular insights and integrate with popular BI interfaces and business systems.
Pecan AI automates predictive analytics to solve business challenges: shrinking budgets, rising costs, and limited AI resources. Pecan’s predictive GenAI platform provides AI-driven predictive analytics that guides data-informed decisions and helps business teams achieve their goals.
With its predictive chat and SQL-based predictive notebook, Pecan AI helps analysts to set up accurate models without prior knowledge of data science. The platform enables easy implementation of classification and regression predictive models, such as customer churn, demand forecasting, LTV, and predictive maintenance.
The platform automates data prep, feature engineering, model building, deployment, and model monitoring.
Features
- Supported:
- Data Analysis
- Decision Making
- Statistical Tool
- Predictive analytics
- Low-code AI
- Integrations
- No data preparation needed
- Health check
12. Alteryx
Alteryx is a low-code/no-code, end-to-end data analytics platform that converges data science, analytics and process automation in a single easy-to-use platform. It enables users to quickly generate insights from large datasets while creating automation “breakthroughs.” Alteryx lists the following capabilities as its main focus points:
- Data preparation and analytics
- Data science and machine learning
- Analytic automation
- Governance and auditability
- Machine learning operations
The Alteryx platform is built on analytic process automation and data privacy and security. Through the Alteryx Analytic Process Automation (APA) Platform, the company offers end-to-end automation for analytics, data science and machine learning processes. This allows the brand to deliver the agility customers need to accelerate digital transformation efforts.
Alteryx APA impacts the transformation of business outcomes as well as the transformation of workforces in organizations. Data privacy and security services from Alteryx aim to build a foundation of trust by covering areas such as information security, data privacy, data transfers, data practices, data subject rights, usage data, ethics compliance, trust, reliability and sustainability in its scope.
- Data preparation and analytics
Alteryx uses low-code/no-code analytics automation to generate powerful insights, enabling analysts to work quickly as the tool sources, blends and enriches data. The platform offers 300+ no-code low-automation building blocks to help teams get started. Users can leverage data cataloging features to discover and govern analytics and data assets for seamless collaboration across the organization.
Alteryx’s data profiling features involve bar charts, scatterplots and colorizations. The data exploration features enable customers to explore their variable distributions and raise their quality. Alteryx also offers data enrichment features to help users understand demographic data from customer behavior and geospatial analytics to explore customer locations on street maps.
- Data science and machine learning
With automated machine learning, predictive analytics and text analytics, Alteryx equips and empowers data science teams with comprehensive and supportive tools. It offers time-series forecasting techniques like ARIMA and exponential smoothing models that are capable of taking seasonality into account. The platform also provides advanced predictive analytics features with over 40 drag-and-drop tools. For users who prefer to code, predictive analytics functions can be coded with Python or R.
Users can swiftly create machine learning pipelines using AutoML and Deep Feature Synthesis. Automated insight generation empowers users to uncover hidden signals. Finally, Alteryx provides text mining and NLP capabilities to unlock hidden insights from PDFs and documents.
- Analytics automation
Harnessing complex data is not an issue with Alteryx, as it delivers a unified approach to data science, analytics and process automation to rapidly tackle real-world problems. Its end-to-end automation functionality allows users to automate data preparation, data science, machine learning, analytics and business processes.
Users can create highly accurate and robust models using automated feature engineering. They can also automate inputs and outputs.
- Governance and auditability
Consistent, auditable and governable analytics ensure data and access to analytics can be democratized throughout an entire organization without losing control. Governed self-service analytics from Alteryx makes sure data is trustworthy and delivered with consistency and auditability. Alteryx offers certified and reusable analytic assets as well as features for sharing and collaboration. Furthermore, it has built-in security, governance and best practices.
- MLOps
Alteryx makes the machine learning lifecycle simpler for its customers. Users can deploy predictive models much faster while ending error-prone, labor-intensive processes that cost precious time and resources. In addition to lifecycle management, its MLOps features include model deployment and model performance monitoring.
Pricing
Alteryx pricing is not only dependent on the package you choose but also on the type of license. For the Alteryx Designer package, an individual user per year license costs $5,195. Prospective users have to contact Alteryx directly for pricing information for the Teams and Organizations licenses.
Alteryx Server and Cloud require prospective customers to contact Alteryx for both individual and team license pricing information. Intelligence Suite costs $2,300, Data Package — Location Intelligence is $11,700 and Data Package — Consumer Intelligence costs $33800 for an individual license, with the Teams and Organizations licenses requiring you to contact Alteryx for more information.
Many of these price points are steep for the average company budget, so be sure to have your staff of data professionals do their own research and ask questions before committing to several tools in the Alteryx portfolio.