
 By

For disruptive digital companies to spur innovation, streamline processes, and keep a competitive advantage, data analytics is crucial. Businesses can find chances for new goods, enhance current services, and make evidence-based strategic decisions instead of relying just on gut feelings by examining consumer behavior, market trends, and competition action. They can innovate more quickly, react to changes in the market more skillfully, and achieve sustained success thanks to this data-driven approach.
Due to the massive volume of data that both individuals and businesses produce on a daily basis, data analytics is becoming more crucial than ever. Extracting useful knowledge and insights from the vast amount of data being generated is crucial, which is where data analytics as a decision-making tool comes in.
You should be aware of the significance of data analytics for your firm if you are the owner or employee of a tech company. It’s what propels greater understanding, wiser choices, and quicker expansion.
However, your company can benefit from your insightful information without hiring a data scientist. We are all empowered by the data around us thanks to the development of self-service business intelligence tools.
Data can help you:
- Optimize your business and make informed decisions by providing insights into customer behavior, market trends, and more
- Improve your user experience by analyzing user behavior and identifying pain points in the user journey.
- Gain competitive advantage by making data-driven decisions, improving efficiency, and identifying new business opportunities.
- Better risk management – by identifying potential risks with data analytics and mitigating them before they become significant problems.
- Predict important events – future trends and outcomes, allowing your team to make informed decisions.
- BI insights – including in areas where you can improve efficiency, reduce costs, and increase revenue
- Business innovation – with bold decisions based on hidden insights in the data you have, and this could result in new business.
Data analytics provides tech companies with the tools they need to turn data into insights, improve their services, and gain a competitive advantage in the market by measuring product performance, development velocity, churn rate and more.
Why Data Analytics is Important for Tech Companies
Let’s take a closer look at the significance of data analytics for tech organizations, which we have already discussed. Three words—data-driven insights—make the use of data analytics crucial for tech organizations.
Thus, technology companies can gain a deeper understanding of consumer behavior, market trends, and product performance by gathering and evaluating vast amounts of data.
Data analytics can help technology companies thrive in:
- Product development: using data analytics to identify customer needs and preferences, which can inform the development of new products and features.
- Customer acquisition and retention: identify potential customers, personalize marketing campaigns, and improve customer retention by understanding their behavior and preferences.
- Operational efficiency: Data analytics can help technology companies optimize their operations and processes, as well as reduce costs
Data analytics is a powerful tool for technology companies to improve performance and drive growth in a rapidly evolving industry.
Compared to other businesses, technology companies see faster transformation. Making accurate selections in addition to using intuition is necessary for new features, products, and customer service strategies. Let’s examine how crucial automated data analysis is to this sector.
Every new user category, marketing initiative, and product upgrade is based on a theory. However, it must be tested in order to function. At this point, analytics becomes a foundation rather than only a helper. It answers issues like what genuinely impacts the customer’s lifetime value, which feature increases subscriptions, and why users don’t finish onboarding.
Data gives tech businesses the ability to make well-informed judgments without having to engage in interminable debates. “We see that” is used in place of “we think.” And who develops and who stagnates is frequently determined by this disparity.
Tech businesses can scale what works with the aid of big data analytics. It helps segment customers, optimize the product, react to market changes, and uncover patterns of effective user behavior. Strong data analytics enable IT companies to identify risks before they become serious and introduce products that will be in demand.
Data Analytics Tools for Tech Companies
Without the ideal instrument to support growth, accelerate development, and boost teamwork, no digital business interested in delving into data analytics is complete.
What qualities ought to be present in a data analytics tool, then? There are a number of features to think about (and confirm it has).
Data Visualization
Good data analytics tools should be able to create visual representations of data, such as graphs and charts, making it easier to identify trends and patterns. Also, it’s much more understandable for anyone and everyone on the team.
Data Integration
The tool should be able to integrate with various data sources, including databases, spreadsheets, and cloud-based services.
Security and Compliance
The tool should have robust security features to protect sensitive data and compliance features to ensure that data is stored and managed according to industry regulations.
Ease of Use
Data management and analytics should be easy to use and require minimal training, making them accessible to users with different levels of technical expertise.
The secret to using data effectively is to make it a company-wide policy, which means that it should be simple to use, comment on, and establish tasks and discussions around.
Therefore, utilizing a digital workspace that combines business intelligence (BI) and data analytics skills could be the solution. It can provide IT organizations a number of advantages.
Here’s why.
Improved Collaboration
An all-in-one digital workplace can bring together teams from different departments and locations, making collaborating and sharing insights easier.
Increased Productivity
Providing access to all the data, tasks, and conversations in one place, an all-in-one digital workplace can reduce the time and effort required to complete projects, increasing overall productivity.
Real-Time Insights
Data analytics and BI capabilities in an all-in-one digital workplace can provide real-time insights into key performance indicators (KPIs) and business metrics, leading to better decision-making.
Streamlined Оperations
An all-in-one digital workplace can lower expenses and streamline operations by offering a consolidated platform for managing all business-related tasks, including data analytics and business intelligence.
Read Also: Exploring the Use of Augmented Reality (AR) Analytics in Marketing
By combining contemporary BI, data analytics tools, and data visualizations with a data catalog for simpler classification and access, Slingshot streamlines the daily use of your data. In addition, this all-in-one digital workspace provides project management with tasks and deadlines, team file management, and chat, all within a single app.
Business Data Analytics and Some Mistakes to Avoid
To assist in making informed decisions, business data analytics gathers, organizes, and evaluates data.
Smart Decision-Making
By looking at past data, businesses can predict what’s coming next, helping them act before problems pop up. For example, using business forecasting techniques, a retail store might check past sales to determine which products will be hot sellers during the holidays. Business intelligence solutions often aid this predictive process.
Better Customer Experiences
When companies understand what customers like, they tailor offerings. Picture a streaming service that suggests shows based on what you’ve watched—it makes for a hyper-personalized experience that keeps coming back, aided by customer segmentation and sentiment analysis algorithms.
Smoother Operations
Automation and cloud computing make it easier to streamline business processes and cut costs. A manufacturing company, for instance, might dig into production data to spot bottlenecks, making things run cheaper through workflow automation and supply chain optimization.
Fueling Innovation
Data analytics sparks creativity and product development by spotting new trends in what consumers want. A tech startup might use deep learning models, real-time analytics, and statistical analysis to find gaps in the market, leading to a new app nobody saw coming.
- Neglecting Data Quality
- Failing to ensure data accuracy, completeness, and consistency;
- Not implementing proper data architecture, data cleansing, and validation processes;
- Overlooking the importance of regular data audits and maintenance.
- Lack of Clear Objectives
- Collecting and analyzing data without specific business goals in mind;
- Failing to align analytics efforts with overall business strategy;
- Not establishing key performance indicators (KPIs) to measure success.
- Overcomplicating Analytics
- Using complex models or techniques when simpler ones would suffice;
- Focusing on sophisticated tools rather than actionable insights;
- Overwhelming stakeholders with excessive technical details about algorithmic trading models or quantitative analysis.
- Ignoring Data Privacy and Security
- Not implementing proper data protection measures;
- Failing to comply with relevant data regulations (e.g., GDPR, CCPA);
- Neglecting to educate employees about data handling best practices.
- Siloed Analytics Approach
- Keeping analytics isolated within specific departments;
- Failing to foster cross-channel analytics, collaboration and data sharing;
- Not establishing a centralized data governance framework.
- Overlooking the Importance of Data Analytics and Visualization
- Presenting data in complex, hard-to-understand formats;
- Not tailoring visualizations to the target audience;
- Failing to use interactive and dynamic visualizations when appropriate.
- Misinterpreting Correlation as Causation
- Drawing incorrect conclusions from correlations in data;
- Failing to consider external factors or anomaly detection;
- Not conducting proper statistical tests and qualitative analysis to validate relationships.
- Neglecting Change Management
- Not preparing the organization for data-driven decision-making;
- Failing to address resistance to change when implementing analytics initiatives;
- Underestimating the time and resources needed for cultural data transformation.
- Lack of Continuous Learning and Improvement
- Not staying updated with the latest analytics trends and technologies;
- Failing to iterate and improve on analytics processes and models;
- Neglecting to invest in ongoing training and skill development for analytics teams.
- Over Reliance on Historical Data
- Focusing too much on past business performance without considering future market trends;
- Not incorporating predictive and prescriptive analytics into decision-making;
- Failing to account for rapidly changing market conditions and disruptive events.
Business Analytics Solutions for SaaS Platforms
Because customers have the option to “unsubscribe” at any time, SaaS systems are always vying for their attention. Here, analytics serve as a radar, revealing where the product is headed, what consumers desire, and potential areas of profit loss for the company.
The ecosystem in which SaaS systems operate is quite dynamic. Although new products are introduced regularly, customer expectations shift even more frequently. Teams must swiftly test hypotheses to observe actual user reactions and make adjustments in real time if they want to remain competitive. All of this becomes speculation in the absence of data.
Understanding who is actually using the product, how customer behavior changes after onboarding, and which features are utilized and which are disregarded can all be aided by business analytics tools.
Additionally, it is crucial that the whole SaaS funnel—from the initial interaction to loyalty—occurs in a digital setting. In other words, every level is measurable. and hence enhanced.
Use Case Examples for SaaS Platforms
- Real-time behavior monitoring
To understand how users interact with the product today, not two weeks after the report.
Customer churn analysis
Not just recording the fact of unsubscribes, but finding patterns that lead to this and taking action to reduce churn rate.
- Feature prioritization
Which features really affect retention or upsell? Customer analytics helps determine what is worth investing in.
- Connection with marketing and sales analytics
Data analysis tools can help you track which channels bring long-term users, what works best, and what initiatives just drain the budget?
Examples for Startups
- Testing hypotheses in the early stages
At the start, most solutions are assumptions. Analytics helps to quickly verify them through numbers: running A/B tests, tracking behavior on landing pages, conversions to different CTAs. Even basic tools like Google Analytics, Hotjar or Mixpanel allow you to see what resonates with users, saving your team months of development.
Interaction analysis with MVP
When the product is still new, it is important not to guess, but to see the clear picture: where users “get stuck”, what they do not click, at what step they fall off. Event trackers like Amplitude, Heap or PostHog work here, allowing you to create a map of user behavior.
- Segment users by behavior
Not all users are the same: some are just testing your product while others are actually willing to pay. Analytics platforms (especially those that integrate with CRM or email automation products like Segment, Customer.io, or Airtable + Zapier) help create precise segments: active users, “silent users,” potential churn, etc. This allows you to speak to each group in their own language.
- Prioritize functionality and features
When resources are limited, you need to know clearly: which feature should be developed first. With analytics tools, product teams can track which features contribute to retention. For example, Retention cohorts in Mixpanel or Amplitude help you understand: “those who used X feature return much more often than others” — so it should be prioritized.
Real-time feedback
Tools like Looker Studio, Metabase, or Redash allow users to visualize key metrics in real time and see changes instantly. This is useful not only for founders, but also for the entire team, especially when you need quick synchronization: what’s happening with the product now? Did the new campaign work? What about conversion after the update?
Data Analytics for Growing Enterprises
At this point, businesses have teams, product lines, and business processes in place, but they may not necessarily have a clear understanding of how everything functions as a whole. Businesses in the manufacturing, retail, logistics, and service sectors that have a physical presence gather a variety of internal data, but they hardly ever utilize it to its full potential.
Analytics is crucial in this situation since it turns different information sources into a reality management system. At this point, a new problem emerges: transparency is necessary for scaling. Where has the money gone? Which outlets of sale just generate turnover, and which are actually profitable? How does the team’s output fluctuate over the year? The solutions to these issues are merely conjectures in the absence of system analytics.
Businesses that have physical infrastructure, such as stores, warehouses, manufacturing facilities, and delivery locations, gather a vast amount of data from marketing platforms, ERP, CRM, product accounting systems, point-of-sale terminals, and production equipment log files. However, each department only gets a portion of the picture, and this data is frequently segregated. Data analytics software transforms an organization’s data into an open, interconnected system.
Use Cases
- Consolidate data from different systems
These companies usually have dozens of data sources: from sales at physical points to online campaigns. Analytical platforms like Power BI, Tableau or Looker help to combine these sources in one visual environment. This reduces chaos, speeds up reporting and reveals dependencies that were difficult to track manually.
- Track process efficiency
Where do delays occur most often? Why is a certain production line running slower? Process analytics tools (Process Mining, Time Series Analytics) allow you to identify bottlenecks in operations and optimize them. Even a simple tracking setup in tools like Zoho Analytics or Odoo can save thousands of dollars every month.
- Inventory and supply management
For companies with physical goods, analytics helps to predict demand, avoid warehouse overstocking or shortages. Predictive analytics (e.g. using Python scripts or specialized platforms like Netstock) allows you to purchase smarter, focusing on seasonality, customer behavior and historical data.
- Optimize costs and budgets
Real-time cost analytics (based on data integration with accounting programs like QuickBooks, Xero or internal ERP) allows CFOs to track financial operations and react quickly. For example, reduce spending on unprofitable channels or shift investments to more profitable products.
- Analyze team performance
Data from HR and project tools (e.g. BambooHR, Jira, Asana) helps you understand how departments work, where automation is needed, which roles provide the most value. Analytics in people management is not about control, but about smart scaling.
- Preparing for scaling or business automation
When a company is preparing for scaling, analytics allows you to model future loads. Visual scenario simulations in BI systems allow you to calculate risks in advance.
Data Analytics for FinTech Businesses
In the fintech industry, a small error can cost a business millions of dollars. Every transaction, money movement, and user click is data in this context.
Digital infrastructure and a regulated environment are two complicated systems that are combined in financial technologies. It must fully adhere to stringent KYC, AML, PCI DSS, and other regulations while still being user-friendly. Without analytics, this would be impossible since data serves as the foundation for scaling, cybersecurity, personalization, and adaption.
When discussing the value of data analytics in business, it enables organizations to:
- Financial data analysis to track customers’ financial behavioral patterns, habits, risk appetite, and churn rate.
- Build decision-making models that take into account hundreds of variables, including non-standard ones (geolocation, behavior in the application, traffic source).
- Instantly detect fraud and respond before the system is compromised.
- Provide transparent data reporting that regulators require automatically, without human intervention.
- Test product hypotheses on real data.
Cases for Fintech
- Real-time risk prediction and user scoring
Fintechs work with customers who can be completely different in terms of trust levels, financial behavior, and credit history. Analytics helps not only react, but also predict: automated scoring based on historical data, behavioral patterns, and even data from open banking API allows you to make decisions about lending or restricting access without human intervention quickly and accurately.
- Fraud detection
Financial fraud is one of the biggest challenges. Analytics tools based on machine learning are able to detect suspicious transactions based on behavior patterns: for example, if a user suddenly withdraws a large amount in another country or makes many micropayments in a short time. This way, the system can automatically block the operation until verification.
- Analytics of customer behavior and user retention
Why do users stop using the application? What features are used most often? How many steps does a customer need to open an account? AI-powered analytics answers these questions and allows you to optimize the product for real scenarios.
- Compliance reporting
In fintech, companies can’t afford to be inaccurate. Regulators require reports, transaction tracking, and process transparency. Advanced analytics tools allow you to save all actions, automatically generate reports for regulatory authorities, and track where an error could have occurred.
- Unit economics optimization
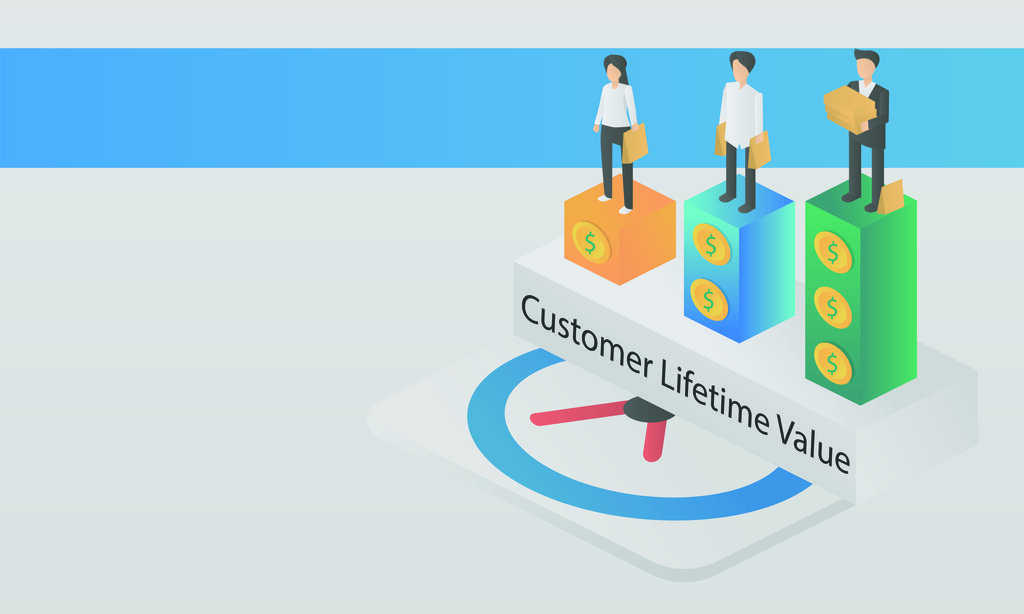
Not all fintechs are profitable at the start. Analytics helps companies understand at what stage of the funnel a user is lost, how much each transaction really costs, and what affects the client’s LTV. Without this data, it’s difficult to scale without getting burned in the process.
Bottomline
Previously, only analysts or data scientists could comprehend advanced analytics. However, that is rapidly changing. More people at all organizational levels may now access and utilize data to guide their work because to the democratization of data. You don’t need a PhD in data science to analyze what’s happening with your company because tools are getting easier to use.
Without a lot of technological knowledge, the food truck leader now visualizes daily sales and customer feedback using a basic app. It’s possible that his staff members have access to the same information. The crew now looks at the figures and makes suggestions for changes to the menu or the timetable, rather than the owner making all the decisions. From the top down to the front lines, everyone is in agreement and decisions are based on facts.









Comments